Last year we wrote about Three Tips to Help Optimize Your Airbrake. It's been one of our most popular articles, and many customers have thanked us for helping them discover features and benefits they didn't realize Airbrake could provide.
That post is barely a year old, but is already desperate for a refresh. We've been building so much stuff lately, and wanted to provide some fresh tips and tricks on how Airbrake can help you optimize your development process.
#1: Advanced Deployment Tracking
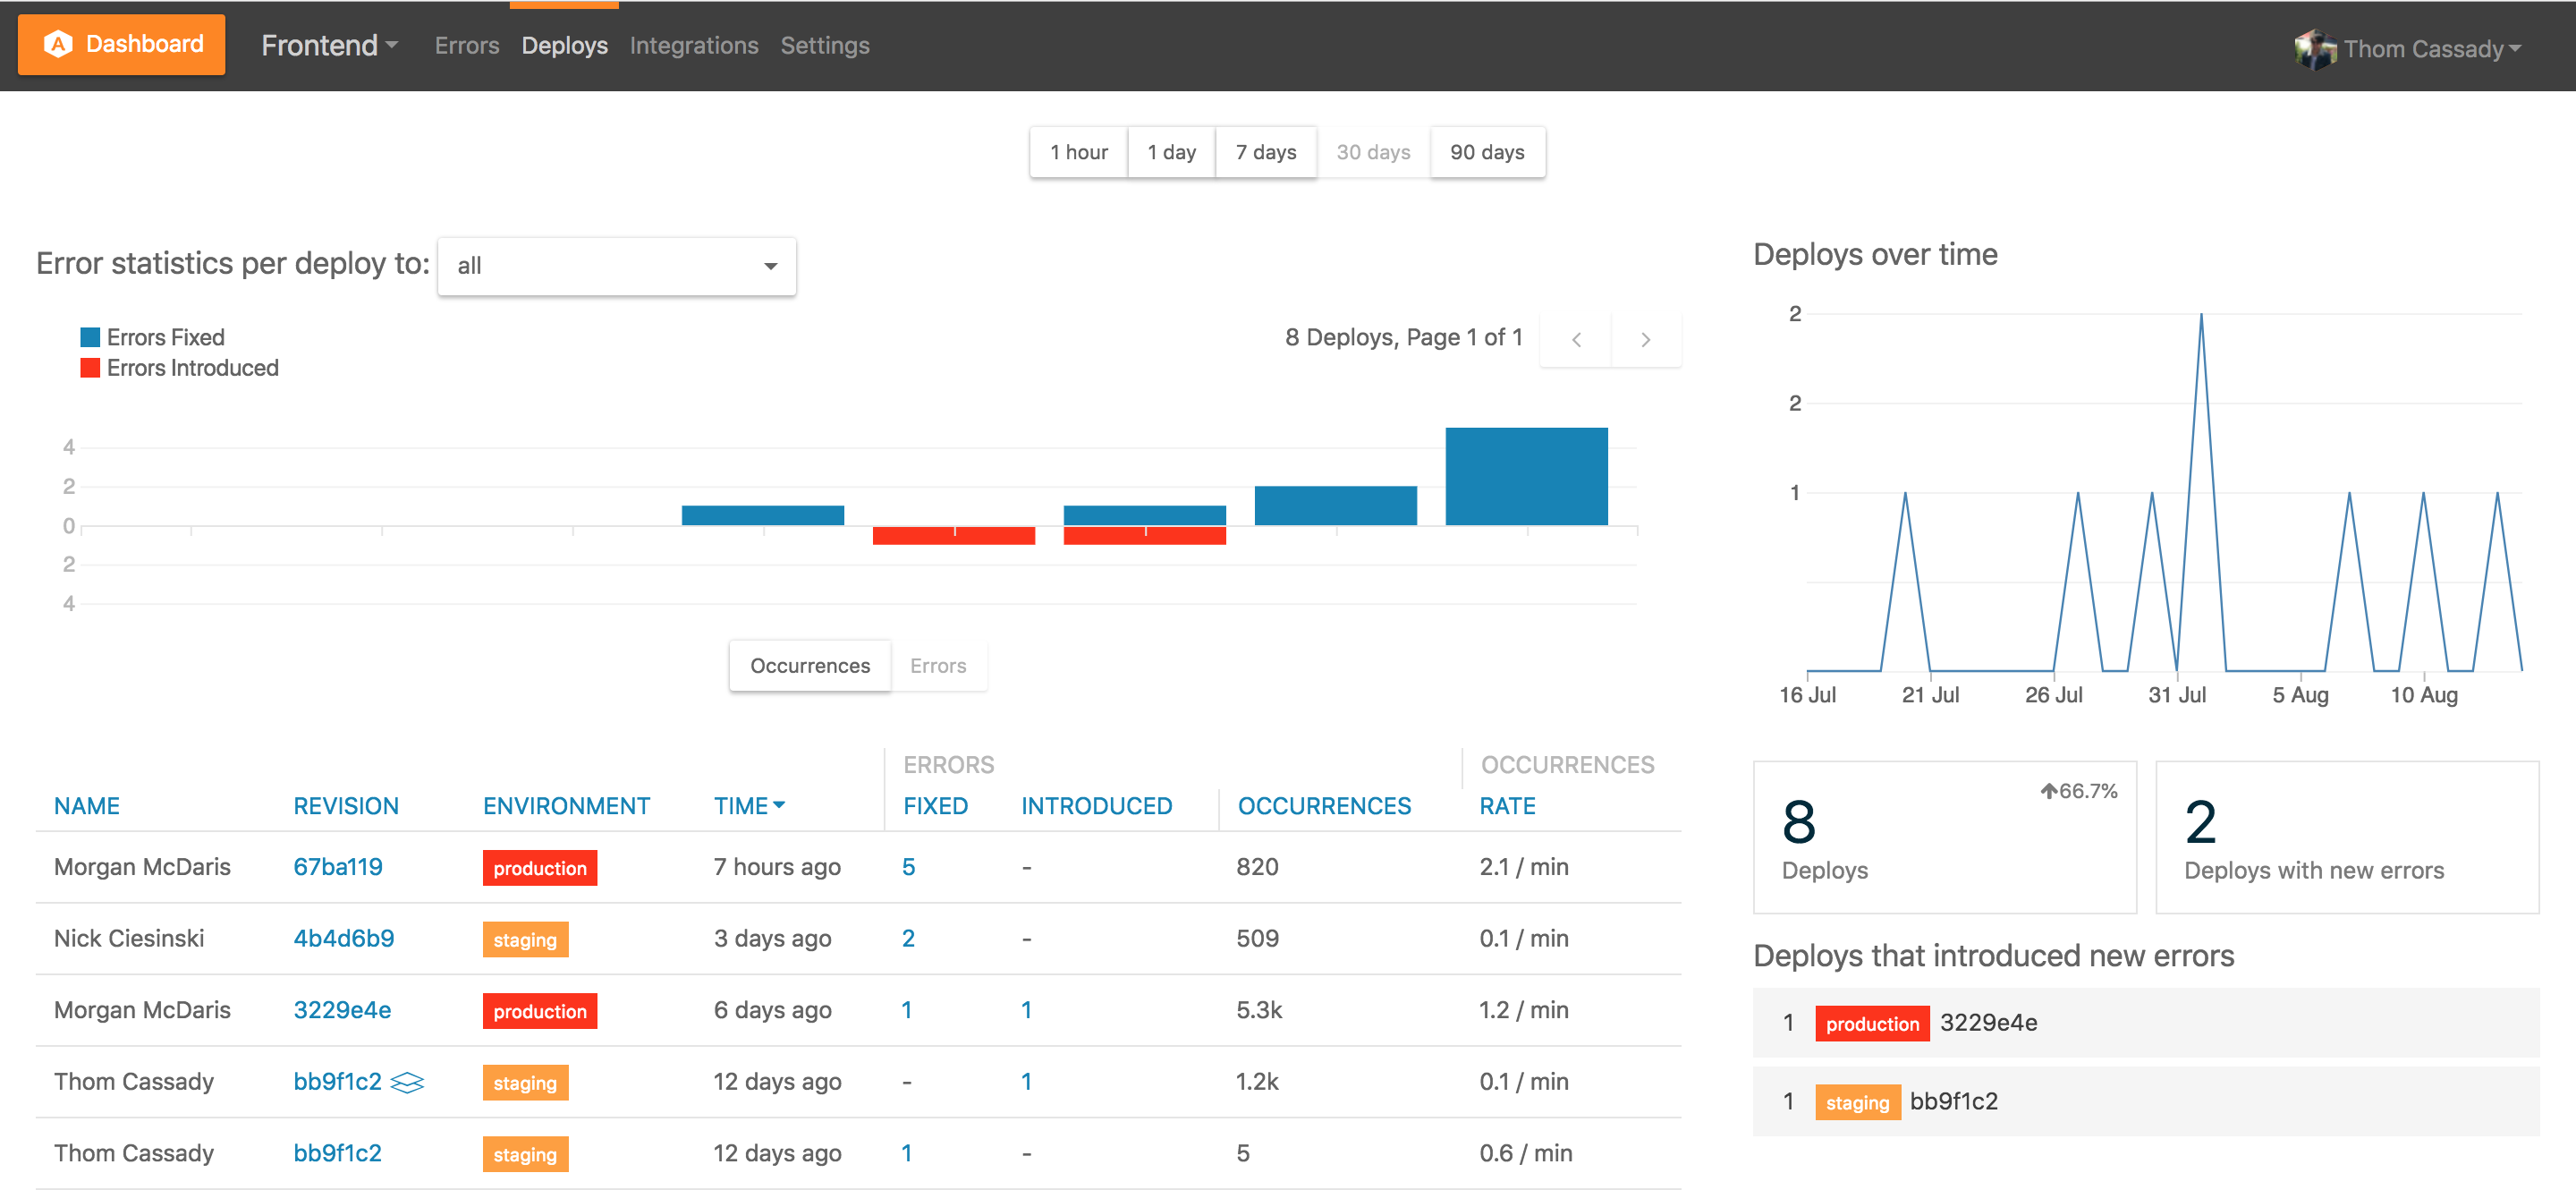
Airbrake has long enabled you to see the overall impact of deployments on error volume. More recently, we've upped our game with the new Deployment Dashboard. Within any project, just click on the "Deployments" tab in the nav bar. You'll see a complete list of your deployments - filterable by environment - along with details on who deployed, when, and what the impact was.
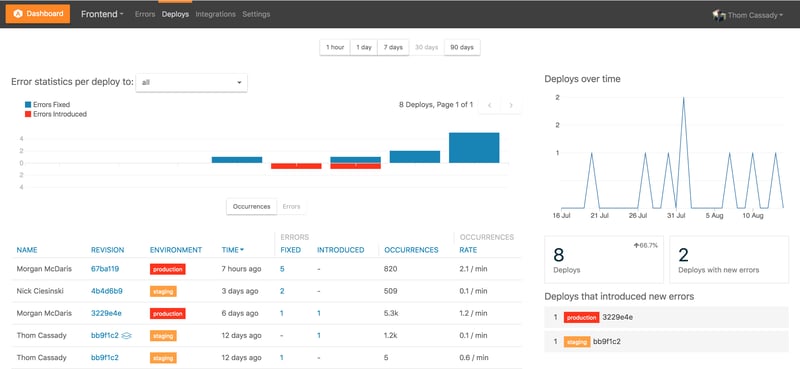
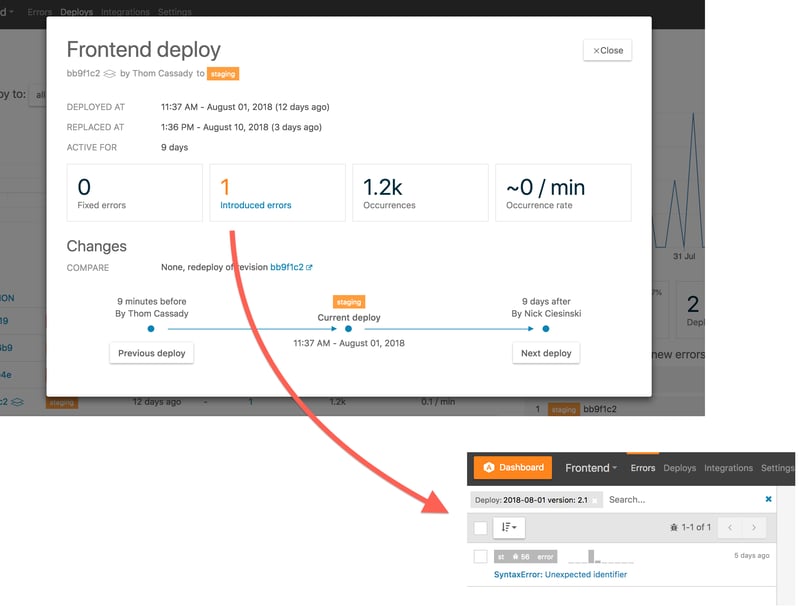
And the best part? Not only can you see how many errors were fixed and introduced by a deploy, you can also click directly through to view those errors. So now you know exactly what problems were caused by every deploy, and have all the details needed to get them fixed quickly.
#2: Search and Filter by Attribute
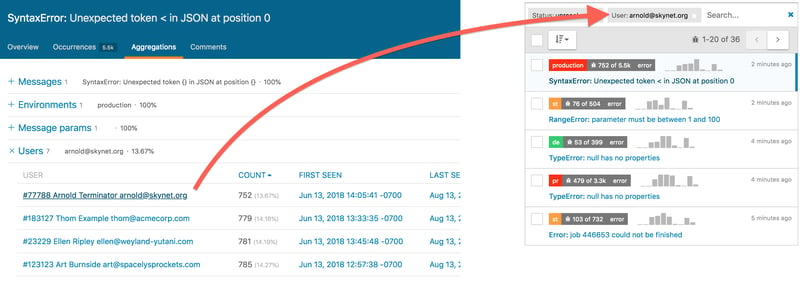
If you've used Aggregations, you know that they are invaluable for understanding the scope of a given error. Is it browser-specific? Which hosts are affected? Which users are impacted? Aggregations can answer all these questions for a given error. But what if you want to flip the script - instead of seeing which users saw an error, you'd like to see which errors a given user saw. Airbrake can do that too.
Either search for the attribute and value you care about. Or, if you happen to be viewing an aggregation, you can click directly on a given attribute to see all matching errors automatically.
#3: Did I miss anything?
Ever show up for work on Monday and wonder what happened over the weekend? Or get back from vacation hoping the word didn't end while you were gone? The Airbrake Dashboard gives you a quick and easy picture of error activity across your whole stack!
(if you aren't using Airbrake across your stack, um, why not? We support every major language and framework. And you can monitor unlimited projects/apps, so there's really no reason not to).
Monday morning I pull up the Dashboard and set the time the time to "90 hours". That lets me see pretty clearly if there were any problems. And if so, I can again click straight through to view the details for any errors.
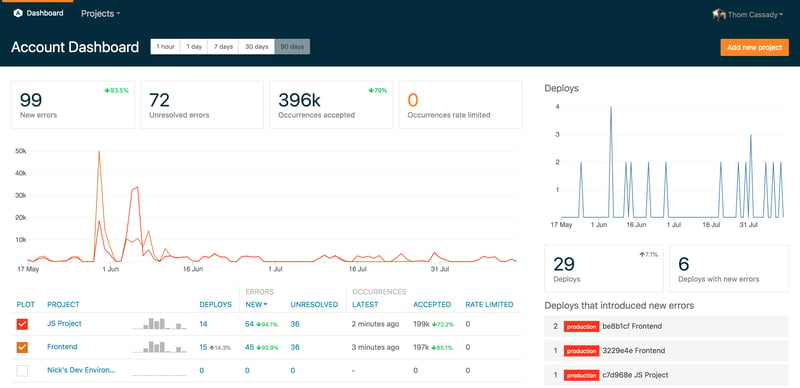
The Dashboard is also great for getting a granular view in a crisis (90 minutes) and seeing the longer-term trend (90 days).
We'll keep updating you on new features as they roll, so stay tuned! If you have questions or feature suggestions, hit us up. We love to help.
