Imagine if you could use Airbrake to not only identify errors and performance issues in your code but to capture output from various tools in your DevOps toolchain.
For modern developers, responsibility extends beyond deploying code and into the tools and processes required to implement and monitor that code.
With the launch of Airbrake Capture, you can finally identify and correlate DevOps issues throughout the lifecycle of your applications (like CI/CD build failures, Cron job failures, and Database backup failures) with errors in your code or your application’s performance metrics.
Using Airbrake’s CLI (command line interface), developers can now use the Capture command across a wide variety of use cases, including:
Running commands locally and sharing the output with your team
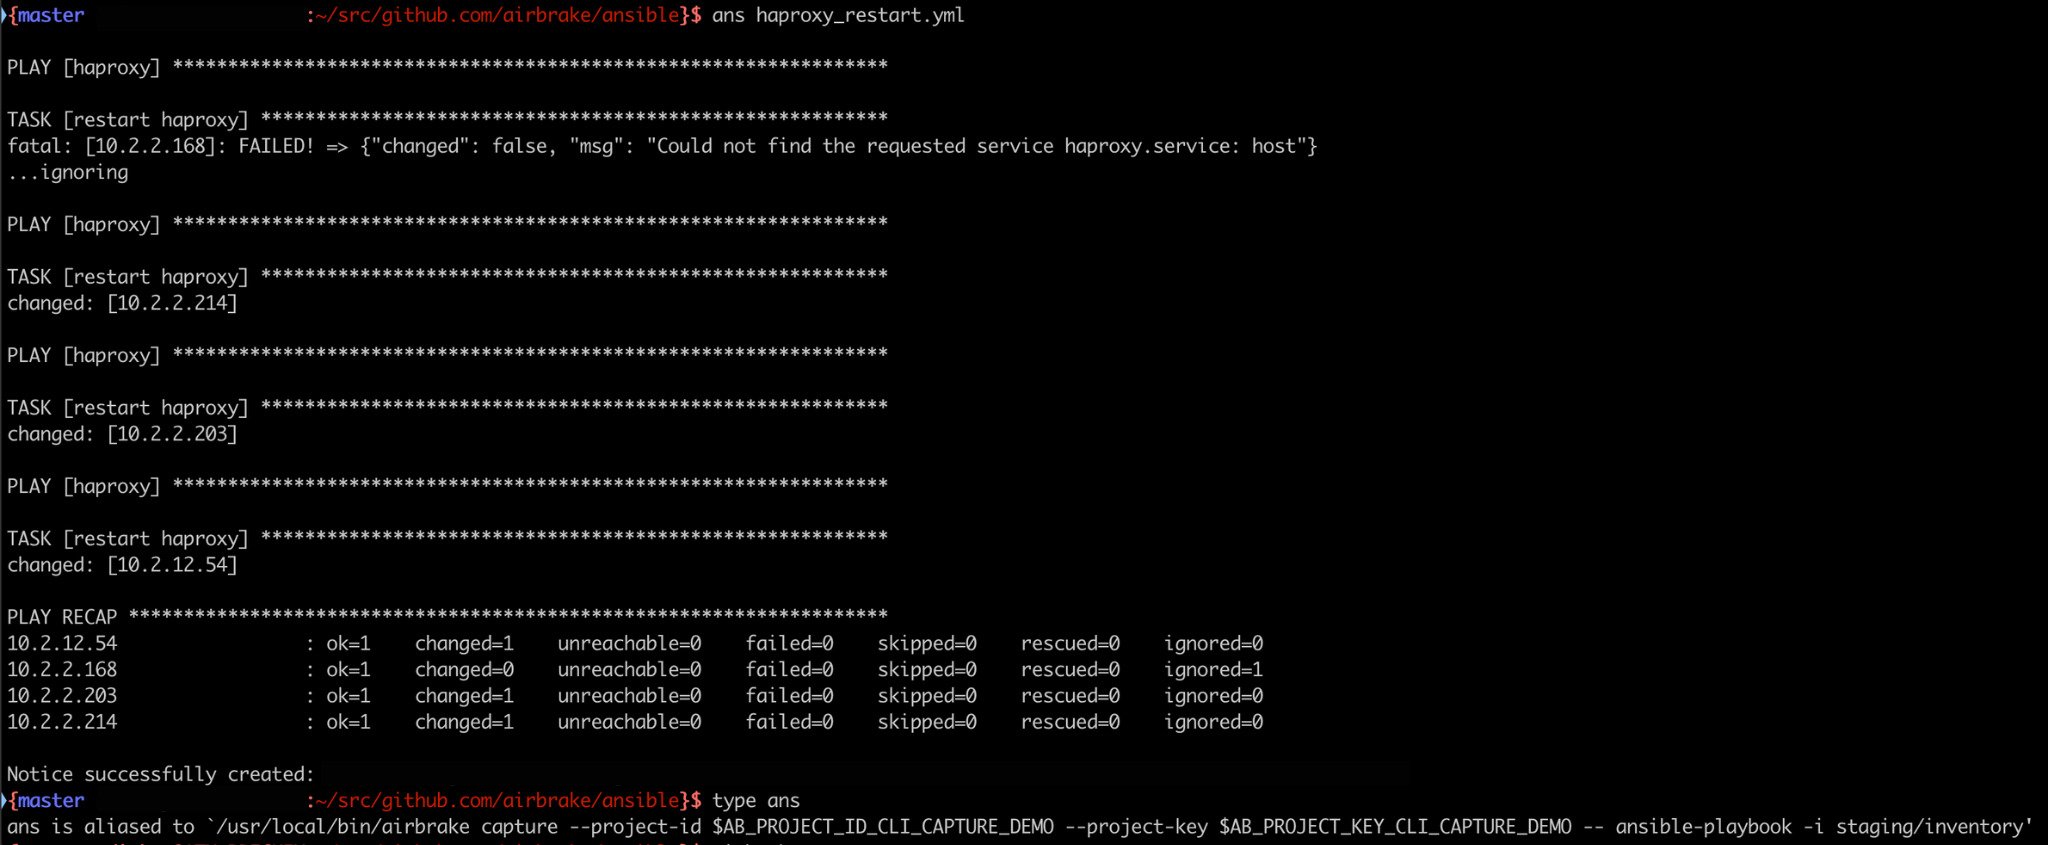
Using Ansible as an example, you can alias the capture command to grab ansible-playbook output and have a centralized location for your outputs. Check out the video below for step by step instructions on how to implement!
Wrapping system services or Cron Jobs
If a service dies or cron job fails, it may not be immediately noticeable because systemd may restart the service or the cron job reruns later and succeeds. Airbrake Capture will alert if this happens.
Wrapping Kubernetes daemons or Cron Jobs
Pods die and restart for various reasons, but if it’s because the code is breaking, you’ll want to know! This is especially important for community projects with a standard Docker image; otherwise, there's no visibility into the code.
Stay tuned in the coming weeks as we explore each one of these use cases in greater detail!
Ready to get started? It's as easy as 1-2-3
Events picked up by Airbrake Capture count toward your plan’s quota exactly how errors in your code do today. This means users can start leveraging this new functionality right away without changing their existing plan or incurring costs!
1. Have unused Airbrake quota?
Just follow the instructions in our docs to deploy the Airbrake CLI. Once you have the CLI, you can use the Capture command to start capturing and reporting the output of entire commands through the Airbrake service. As stated previously, errors identified by Airbrake Capture will count toward your plan’s quota exactly how errors in your code do today, meaning you can start using this new functionality right away without additional costs.
2. No quota to spare?
Upgrade to the next tier or use on-demand errors and follow the instructions above.
3. Concerned about your error spend?
Follow the instructions in docs to set error usage caps (please be aware: even if your app generates errors, you’ll stop receiving Airbrake notifications once you hit your monthly cap).
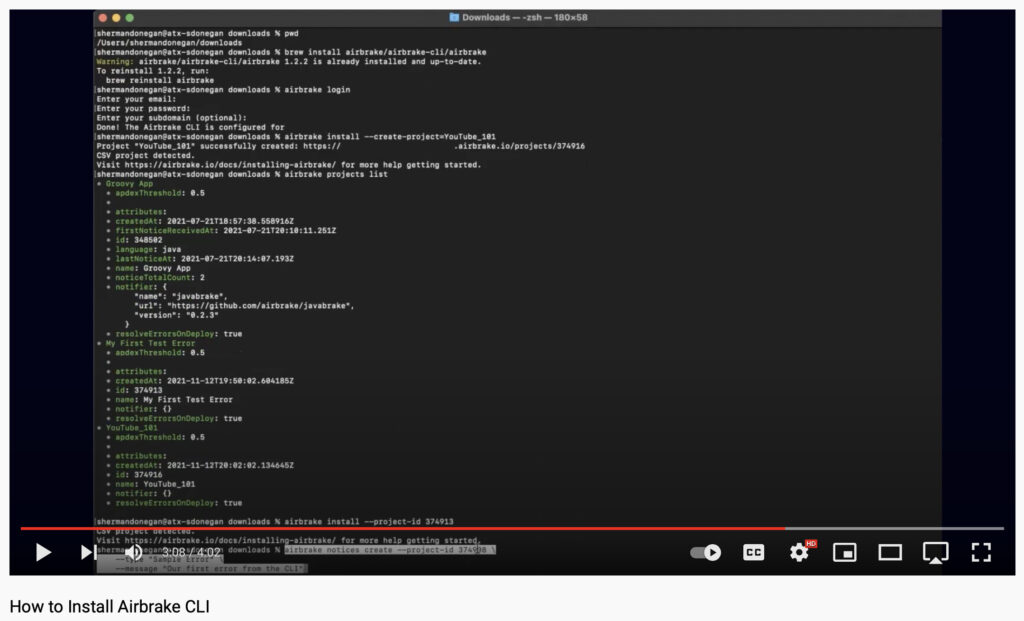
See how it's done and check out our How to Install Airbrake CLI video or visit our docs.
If you have any questions or feedback, don't hesitate to email us at support@airbrake.io!

.png)