
What is Node.js Profiling
Node.js profiling allows you to use the profiler already available to you (--prof) through the Node.js program and discover performance-related issues within your application. With this profiler, you'll be able to delve into the performance of your application and find what's causing bottlenecks.
Common performance concerns include:
1. Memory issues
2. CPU issues
3. Files/code leading to slow performance
It can be tough to know precisely where the issue lies when you don't have full observability of your product. One step you can take is to reach out to other teams who might have visibility into the networking stack. This can take time.
Node.js profiling offers you a way to access valuable information even if you don't have full observability of your application.
How To Use Profiling
In the past, you needed V8 source code to profile code. With the Node.js 4.4.0 update, that's no longer necessary. Instead, you can use Node.js' built-in profiler.
Here’s how it works:
Run your application using the built-in profiler:
NODE_ENV=production node –prof app.js.
Once your app is up and running, try to recreate an issue your users are complaining about within the app. For example, you notice sign-up rates drop off due to high latency. To find the issue, you decide to profile the sign-up page.
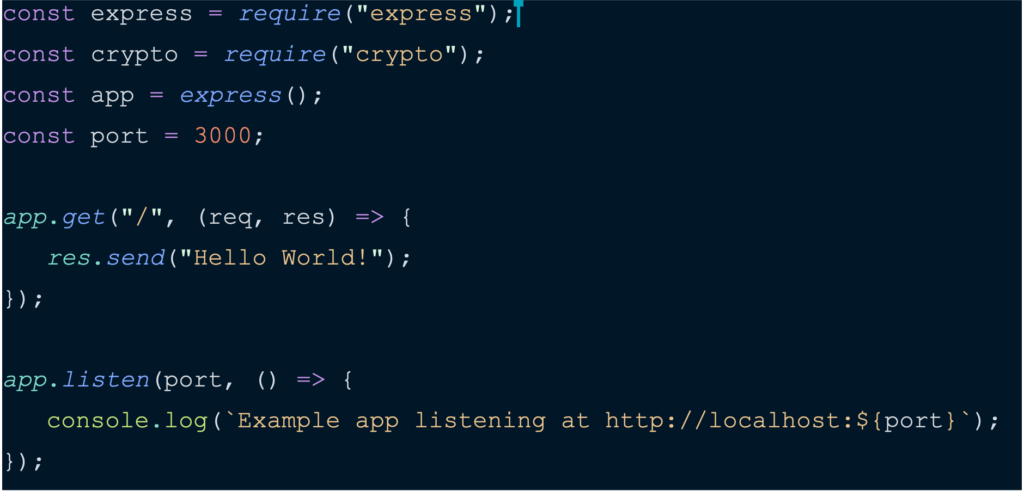
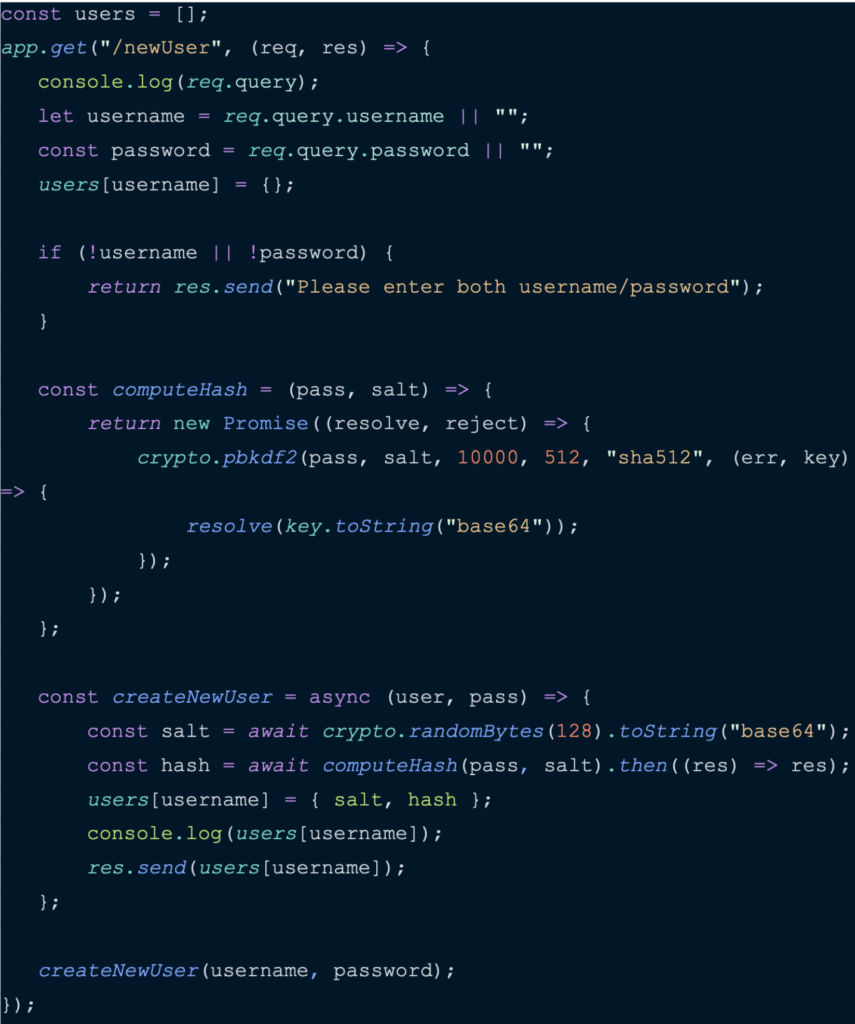
To show how Node.js built-in profiling works, we will set up an Express application that lets users sign up with a username and password.
NOTE: This code is only for demonstration purposes, and users shouldn't use this in production environments.
The following boilerplate code can be used to set up a simple Node Express application (assuming the node app is initialized and dependencies are installed).
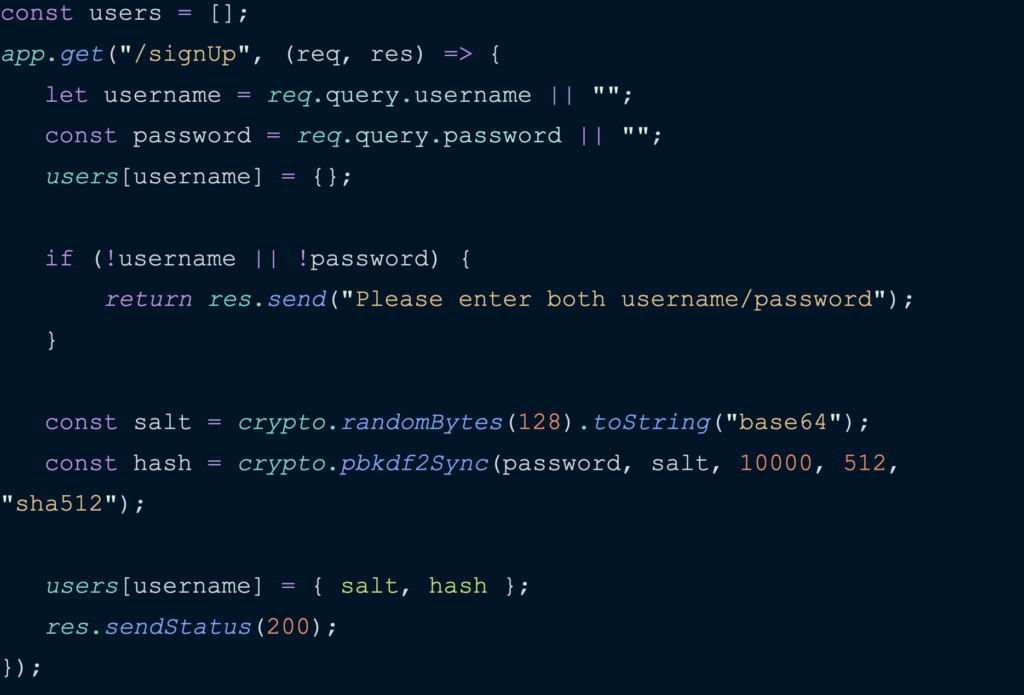
Our application will create an endpoint/handler (“/signUp”), which users will use to sign up for our application. Once the user provides a username and password, the passwords will be stored using encryption. For this demo, we'll use a crypto module for Node.js.
To identify performance issues within our application, use a benchmarking tool called autocannon to simulate heavy traffic on our Web application.
Start up the app with the built-in profiler. We can easily do this by running the following command. This will generate a tick file, which contains profiling information.

Add some load with autocannon using the following command:

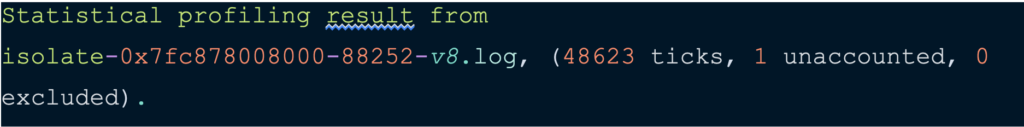
As mentioned above, using the --prof command will generate a tick file in the same directory as your application. The file name will have a format like isolate-XXXXX-v8.log, where “X” represents the digits. This is a raw log file. Use the following command to make it a human-readable file:

You'll notice that the file is broken into multiple sections. First, take a look at the start of the file. It shows that our code has taken 48623 ticks. We can think of ticks as one CPU clock cycle by a node process.
Following this is the “summary” section.
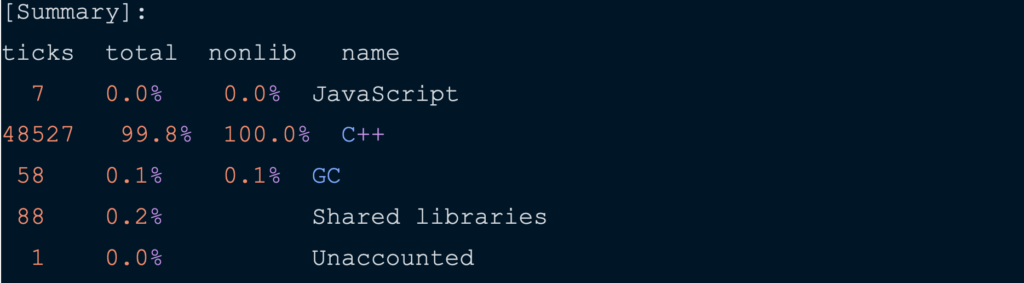
As you look through your tick file, you'll notice all of the following:
- Ticks: the amount of random data pulled from your application
- Total: the total number of samples gathered
- Nonlib: The percentage of non-library code
- Name: the language
This summary shows that C++ functions cause 99.8% of the CPU load. Looking further down into the log file, we'll see that the pbkdf2Sync C++ function (which generates the hash for the password) accounts for almost 99.6% of CPU time.

Now that we identified the source of performance degradation within your application, we can work towards optimizing it. The pbkdf2Sync performs the password hash synchronously, which ties up the event loop.
(Interested in learning more about the JavaScript event loop? Check out this great video from the JSConf).
Use the asynchronous version of the pbkdf2Sync function, which is also called pbkdf2, to improve performance. This will not prevent the event loop from working on incoming requests when computing a password hash.
Once we've finished optimizing our code, run the same profiling process and look at the log file after .txt conversion. Our code is now taking 1916 ticks. With our code optimization, we have managed to reduce the number of ticks from 48623 to 1916.

It might take some time to become familiar with these charts, but once you do, you’ll have access to valuable information regarding slowdowns within your application.
You have all the information you require to diagnose and fix a potential bottleneck. The downside to this method is it is time-consuming. Debug your application more quickly using Airbrake Error and Performance Monitoring.
A Shortcut to Node.js Profiling
Consider Node.js profiling, while effective, the long way when it comes to finding issues within your application. Airbrake Error and Performance Monitoring allows you to find bottlenecks in your application quickly, right down to the exact route that's causing performance issues.
By using the Airbrake Performance tab, you'll improve visibility into your application with tools that provide information on requests, request rates, and response times, all of which accumulate into an Apdex Score.
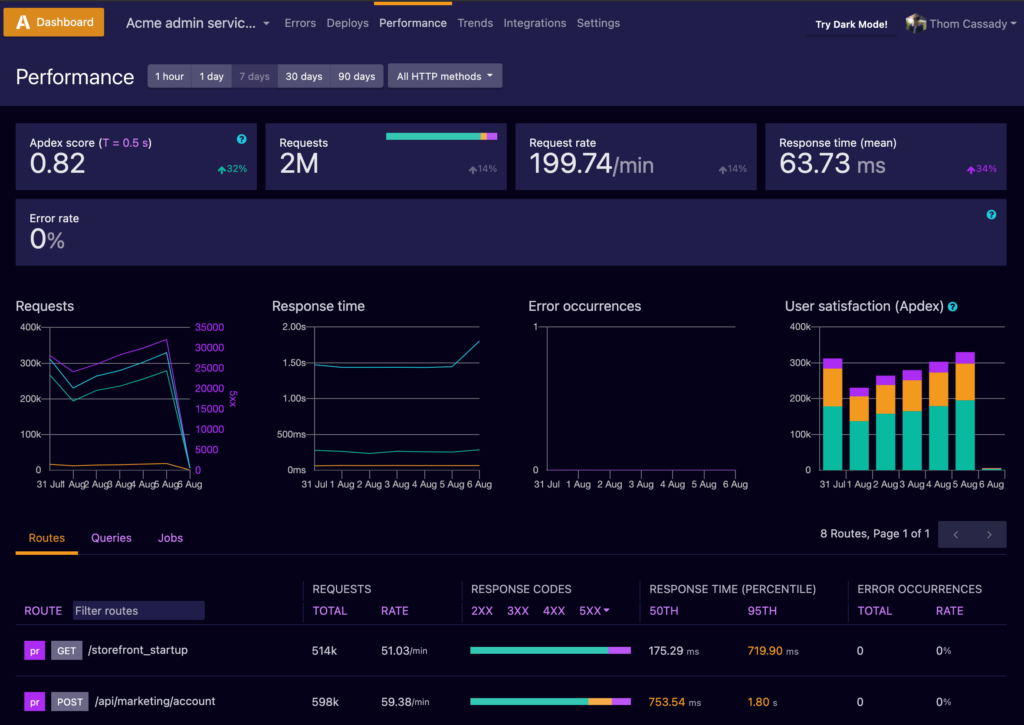
You can further drill down into routes leading to slowdowns and bottlenecks in your application.
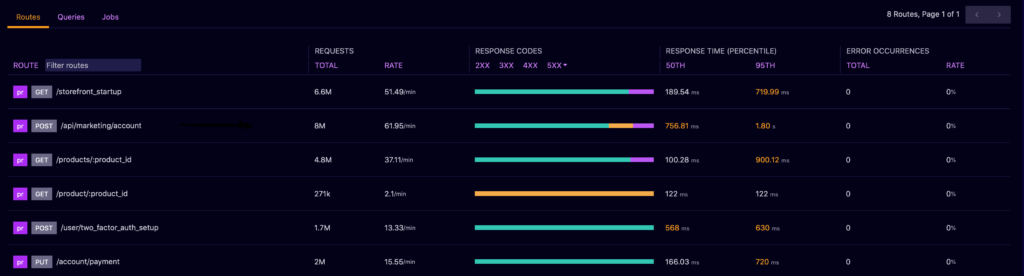
Here's a great example: As you're scrolling through routes, you notice that the /api/marketing/account has a response time over one second.
After you click on that specific route, you’ll be taken to a dashboard that provides a thorough breakdown of what’s going on and, voila! There's the file that's impacting response rates.
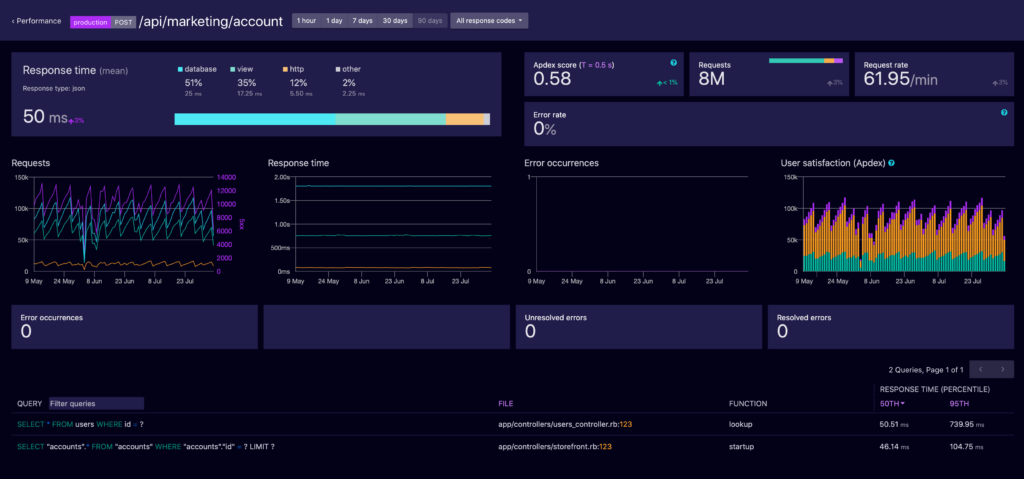
With only a couple of clicks, you found one of the bottlenecks that exist within your application, without having to use the Node.js profiler.
Want to try for yourself? Sign-up for a free 14-day Airbrake trial to discover the power of Airbrake today! Every Airbrake account comes with unlimited user accounts, unlimited projects, and unlimited integrations.