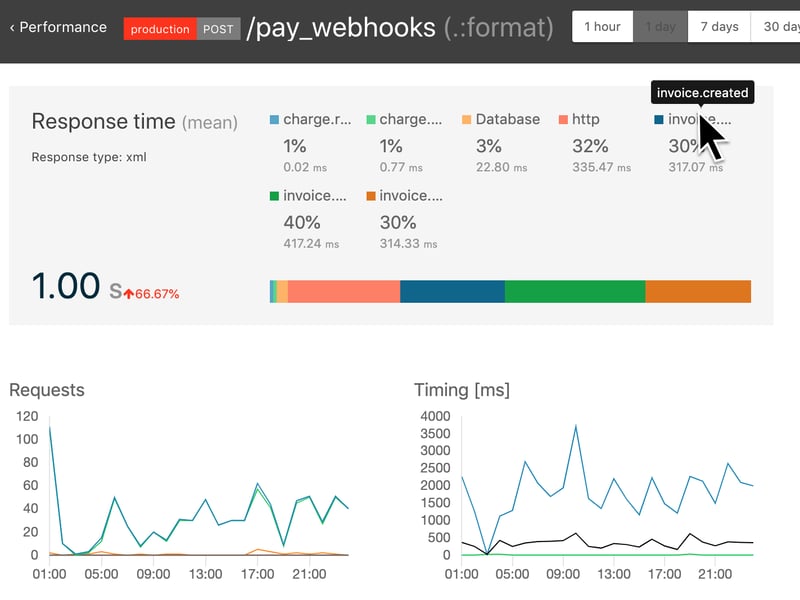
We hope y'all have been digging the sweet, performancey goodness that is the newly released Performance Monitoring for Rails, Go, Flask, and Django apps. We just wanted to shine a spotlight on one of the supporting players: the Performance Breakdown section. Airbrake Performance Monitoring enables you to quickly pinpoint performance problems in your applications, the Performance Breakdown feature gives you the debugging clues you need to debug and fix the problem quickly.

Drilling Down into Real Issues
The project level Performance Dashboard is a great place to start. It gives you a broad picture of your app’s performance trends and helps you pinpoint slow performing routes and other issues. After you do find a route you want to investigate is where Performance Breakdowns come in.
Learn What Is Impacting Performance
What’s fast? What’s slow? What is actually the main contributor to a downward trend?
The Performance Breakdown is a summary of response timing across all the monitored requests for a specific route. It shows you how long each part of the request took (fun fact: this was most requested feature in the private Performance Monitoring beta). This helps to show you what the biggest factor is in the response time of a given route.
Breakdown Categories
Typically, that timing breakdown contains items like:
- Database
- View
- HTTP
- Other: this can be slow performing code, network latency or anything else that doesn't fit into the standard (or your custom) categories.
Custom Categories
And another cool part: it’s all customizable! You can add anything to this section (like the screenshot above shows) by utilizing the notify_performance_breakdown function.
Check out Performance Breakdowns and other useful features by enabling Performance Monitoring!

.png)

