.png)
As we outlined in the previous blog post “top serverless platforms to deploy your react app”, there is a lot happening in the space of developer tools. Especially in the workflow around writing and deploying code. One workflow that’s gaining traction: Replit.
Replit takes the development experience one step further from Netlify, Vercel, and other click-to-deploy platforms by offering a full editor experience in the environment and a community for sharing code in the form of Repls. It’s a great way to write a proof of concept code. Due to its unique structure, we wanted to write a blog post walking you through setting up and monitoring a Python project on Replit using Airbrake Error and Performance Monitoring.
In this blog, we’ll create a simple Hello World API and explore how Airbrake can provide visibility into errors and performance of the API.
Creating our HelloWorld Repl
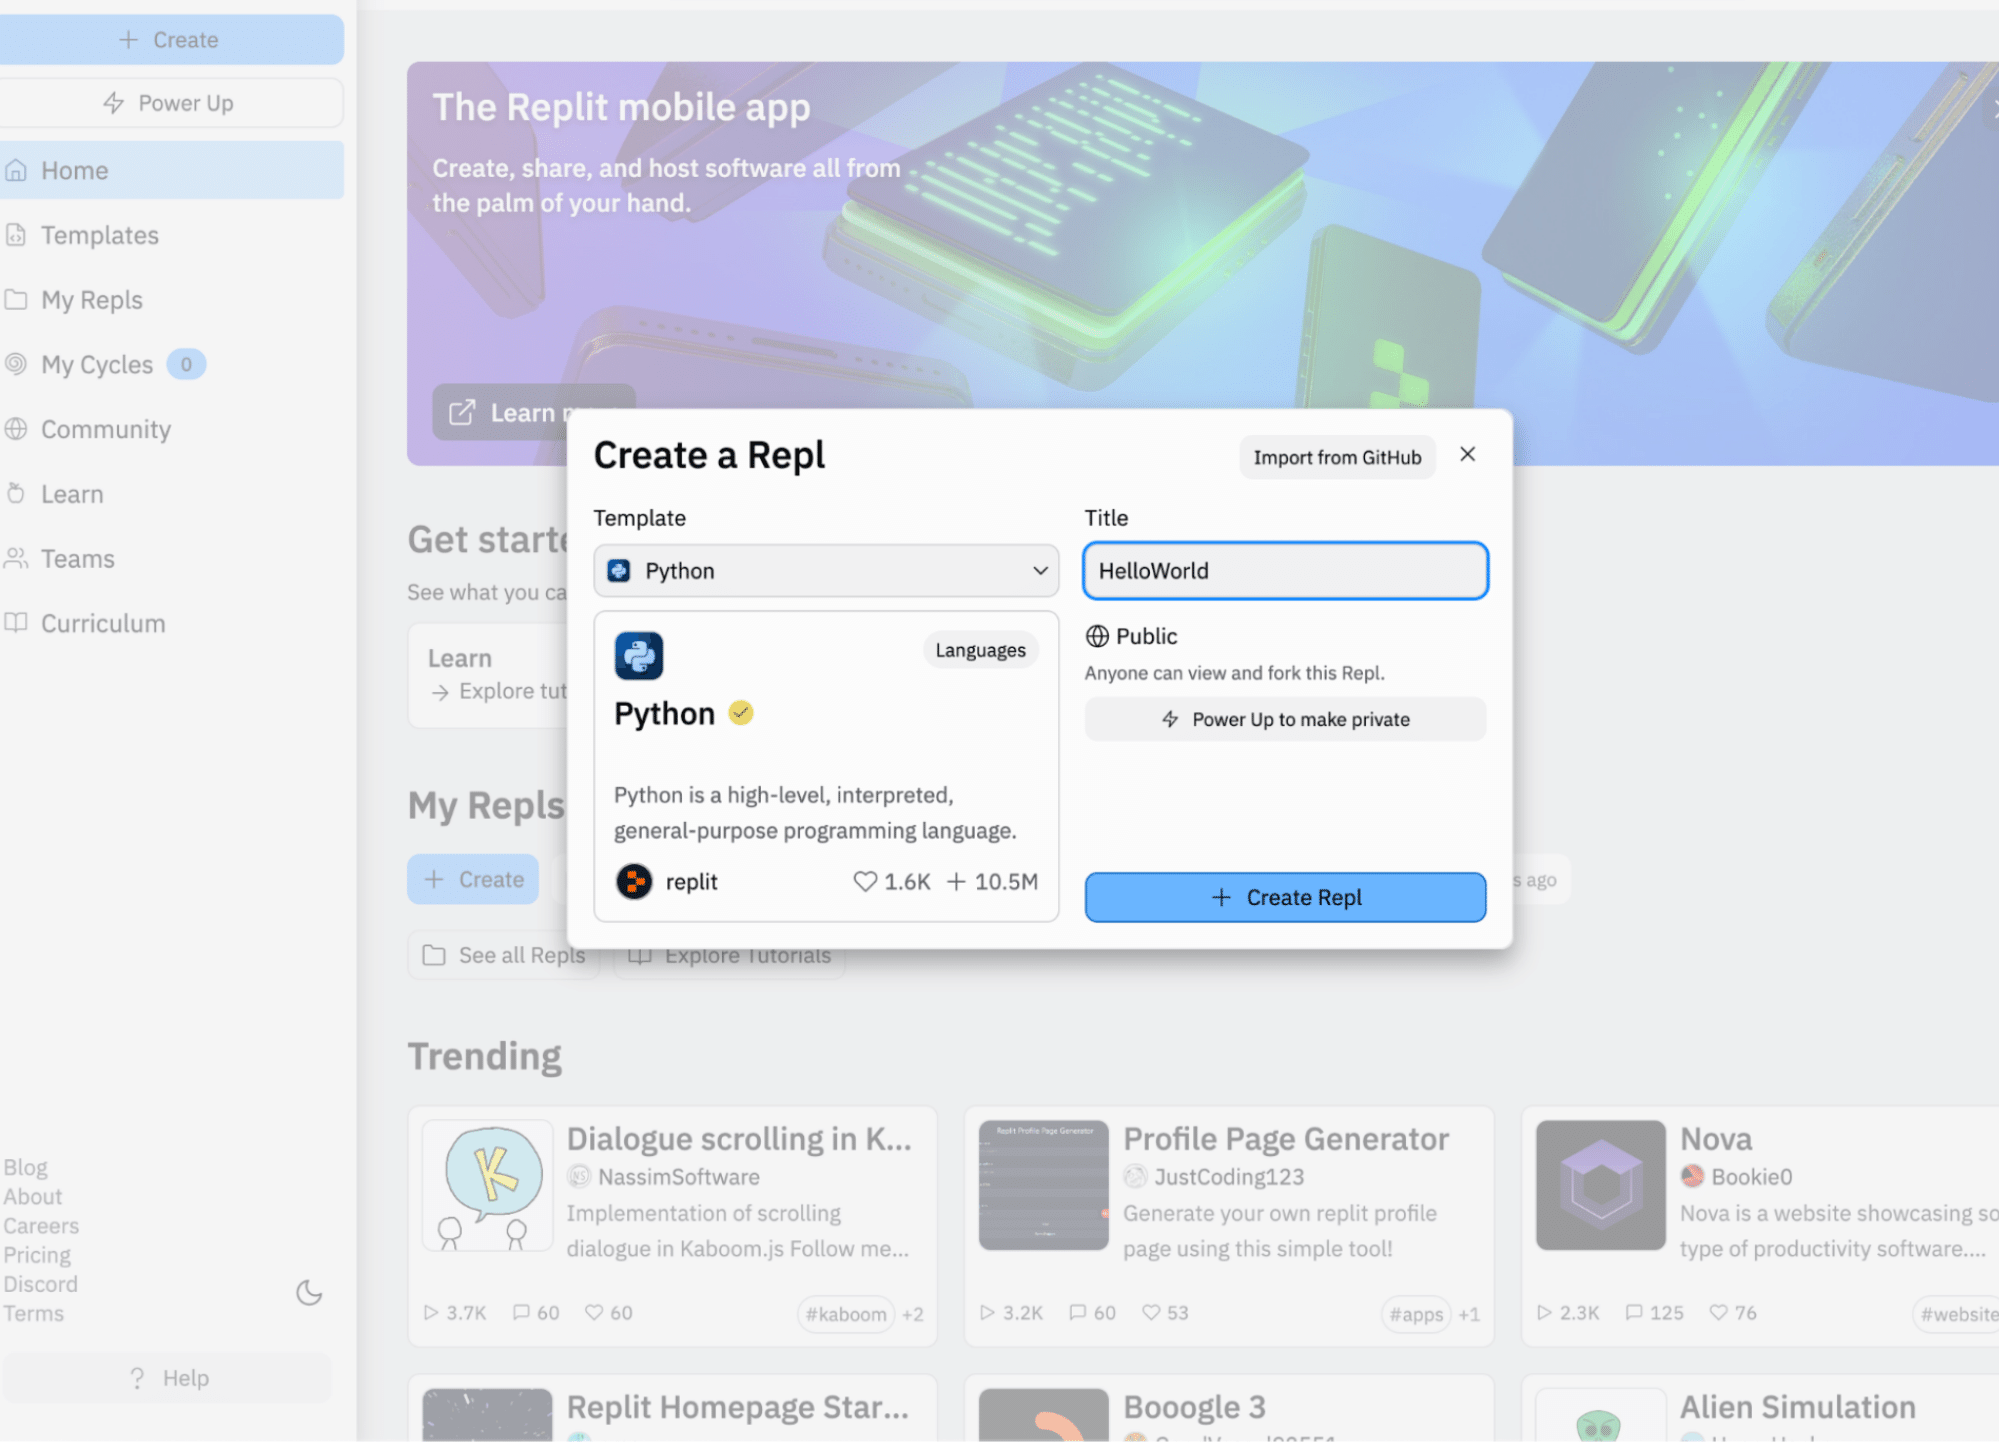
First, we need to create an account on replit.com. In this example, we created our first Repl using the Python template. We named it “HelloWorld” to capture the service we will be providing to the world.
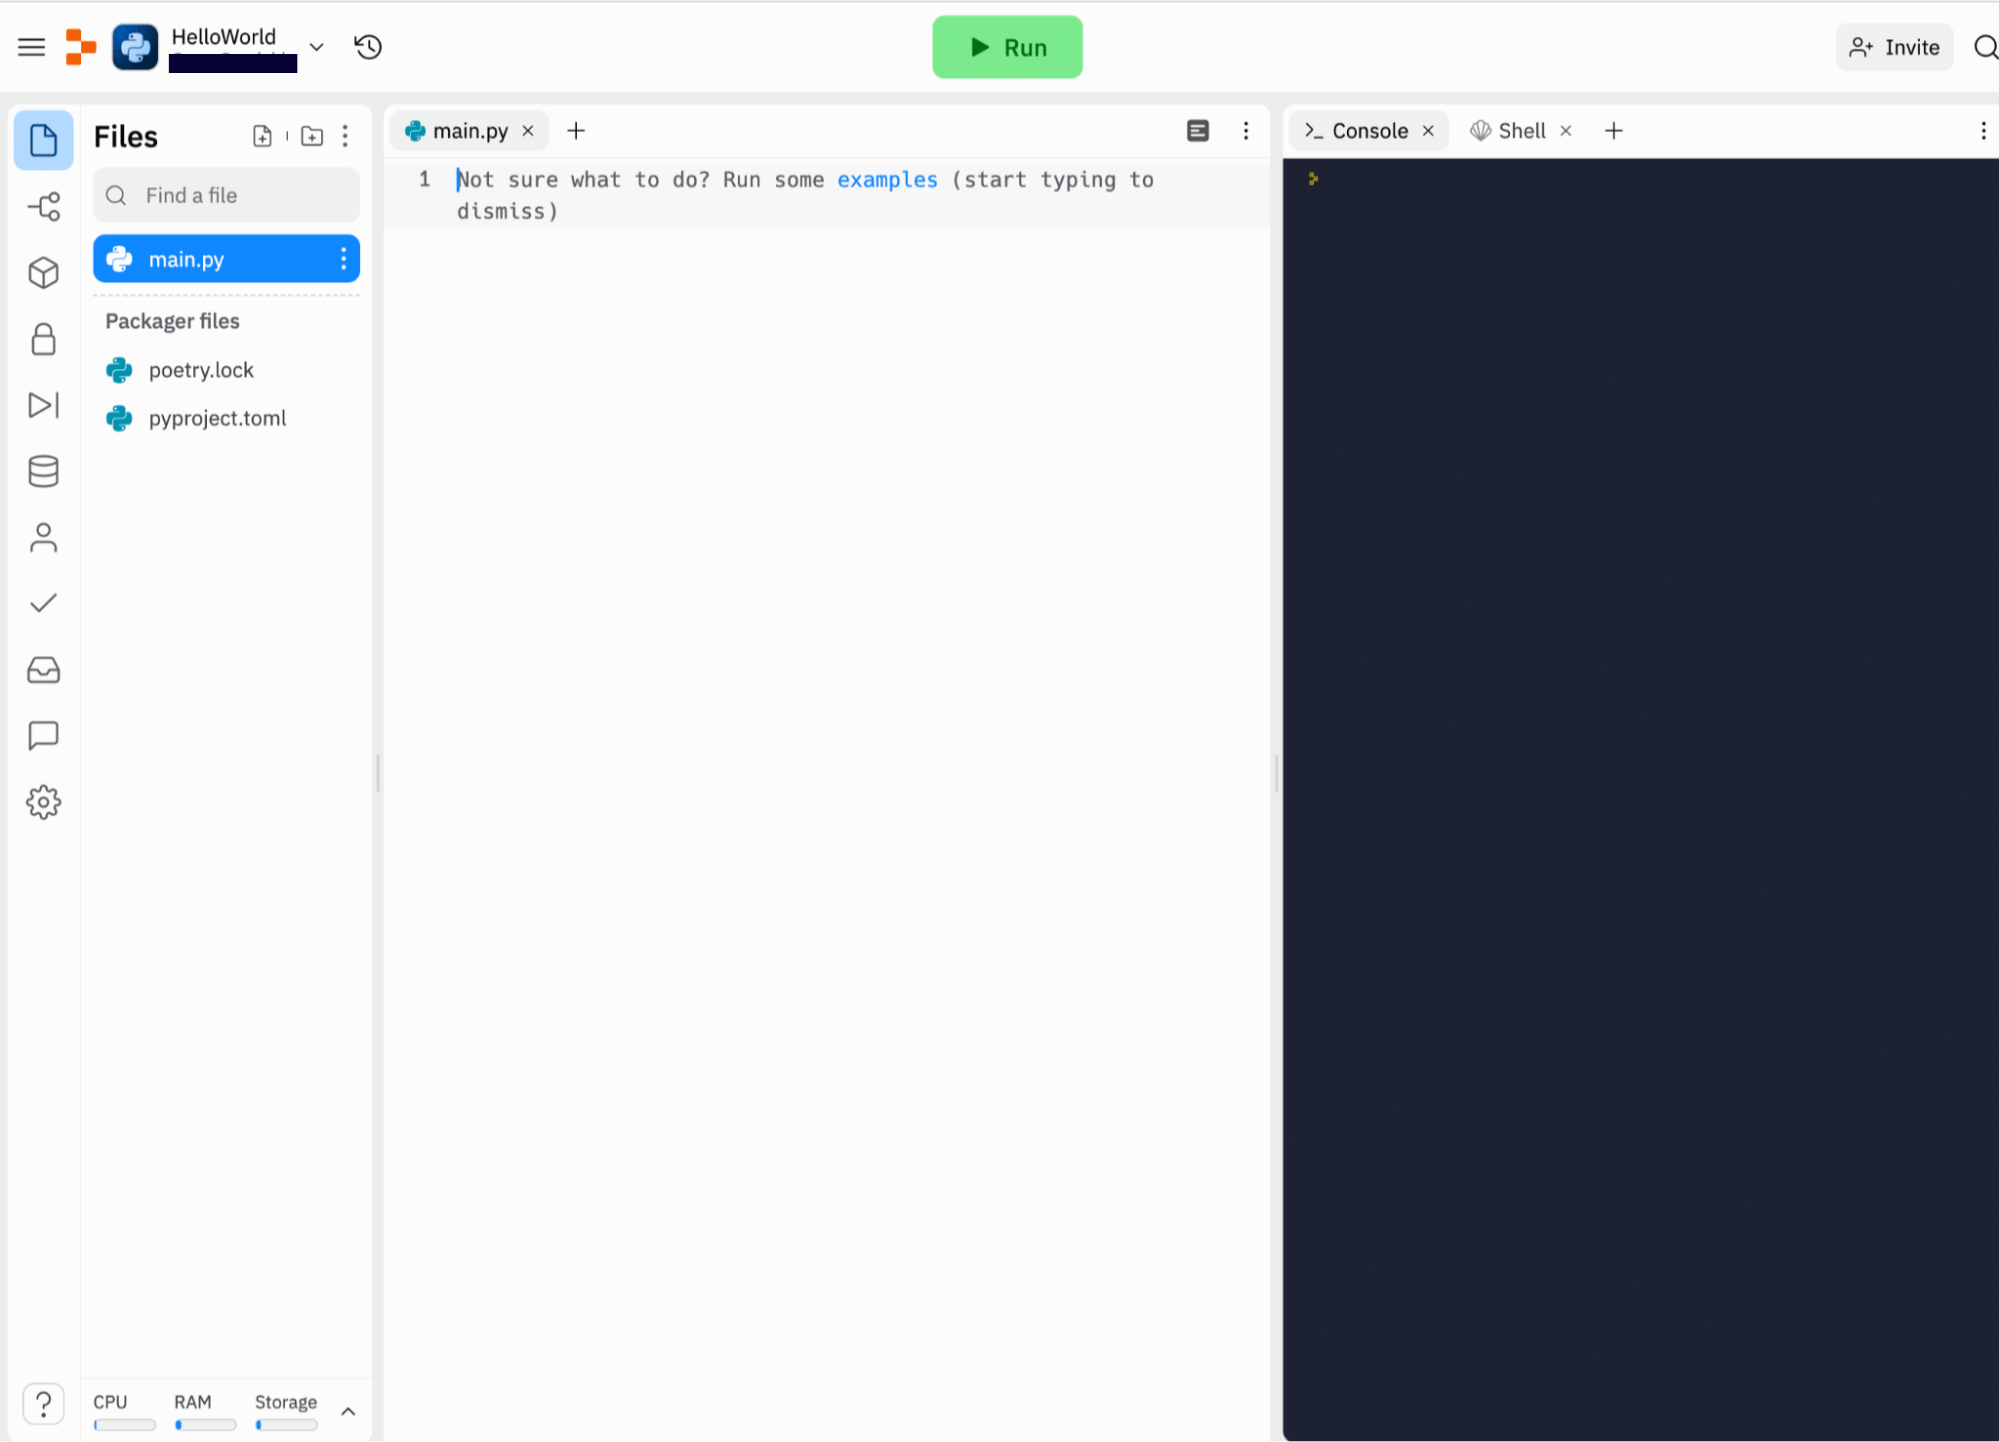
Once we initiate the project, we are brought into the main view of Replit.
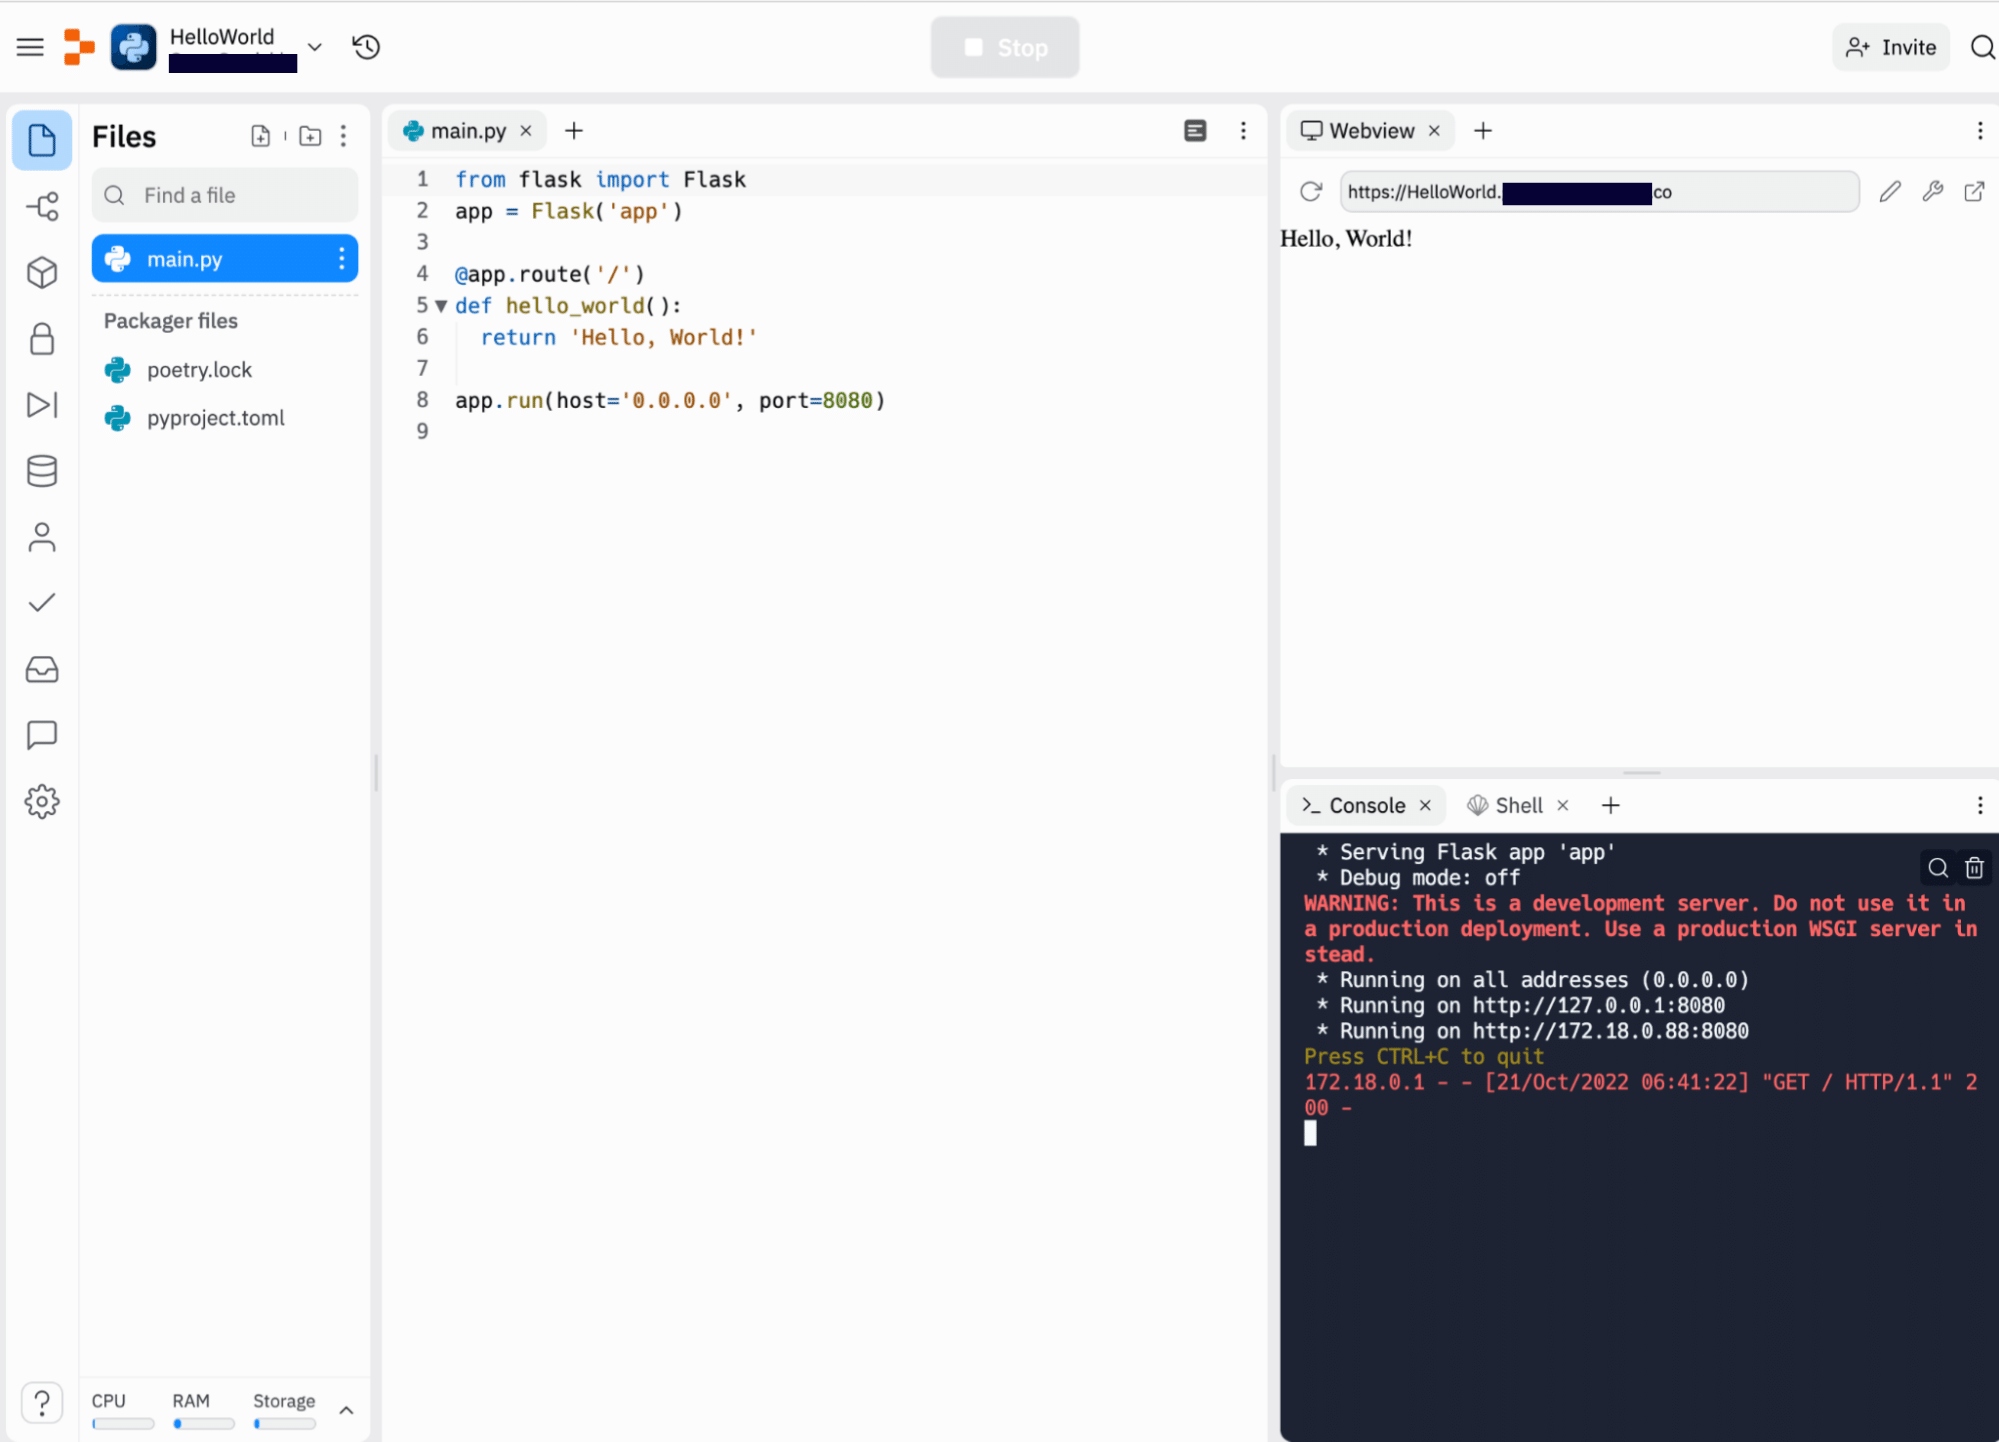
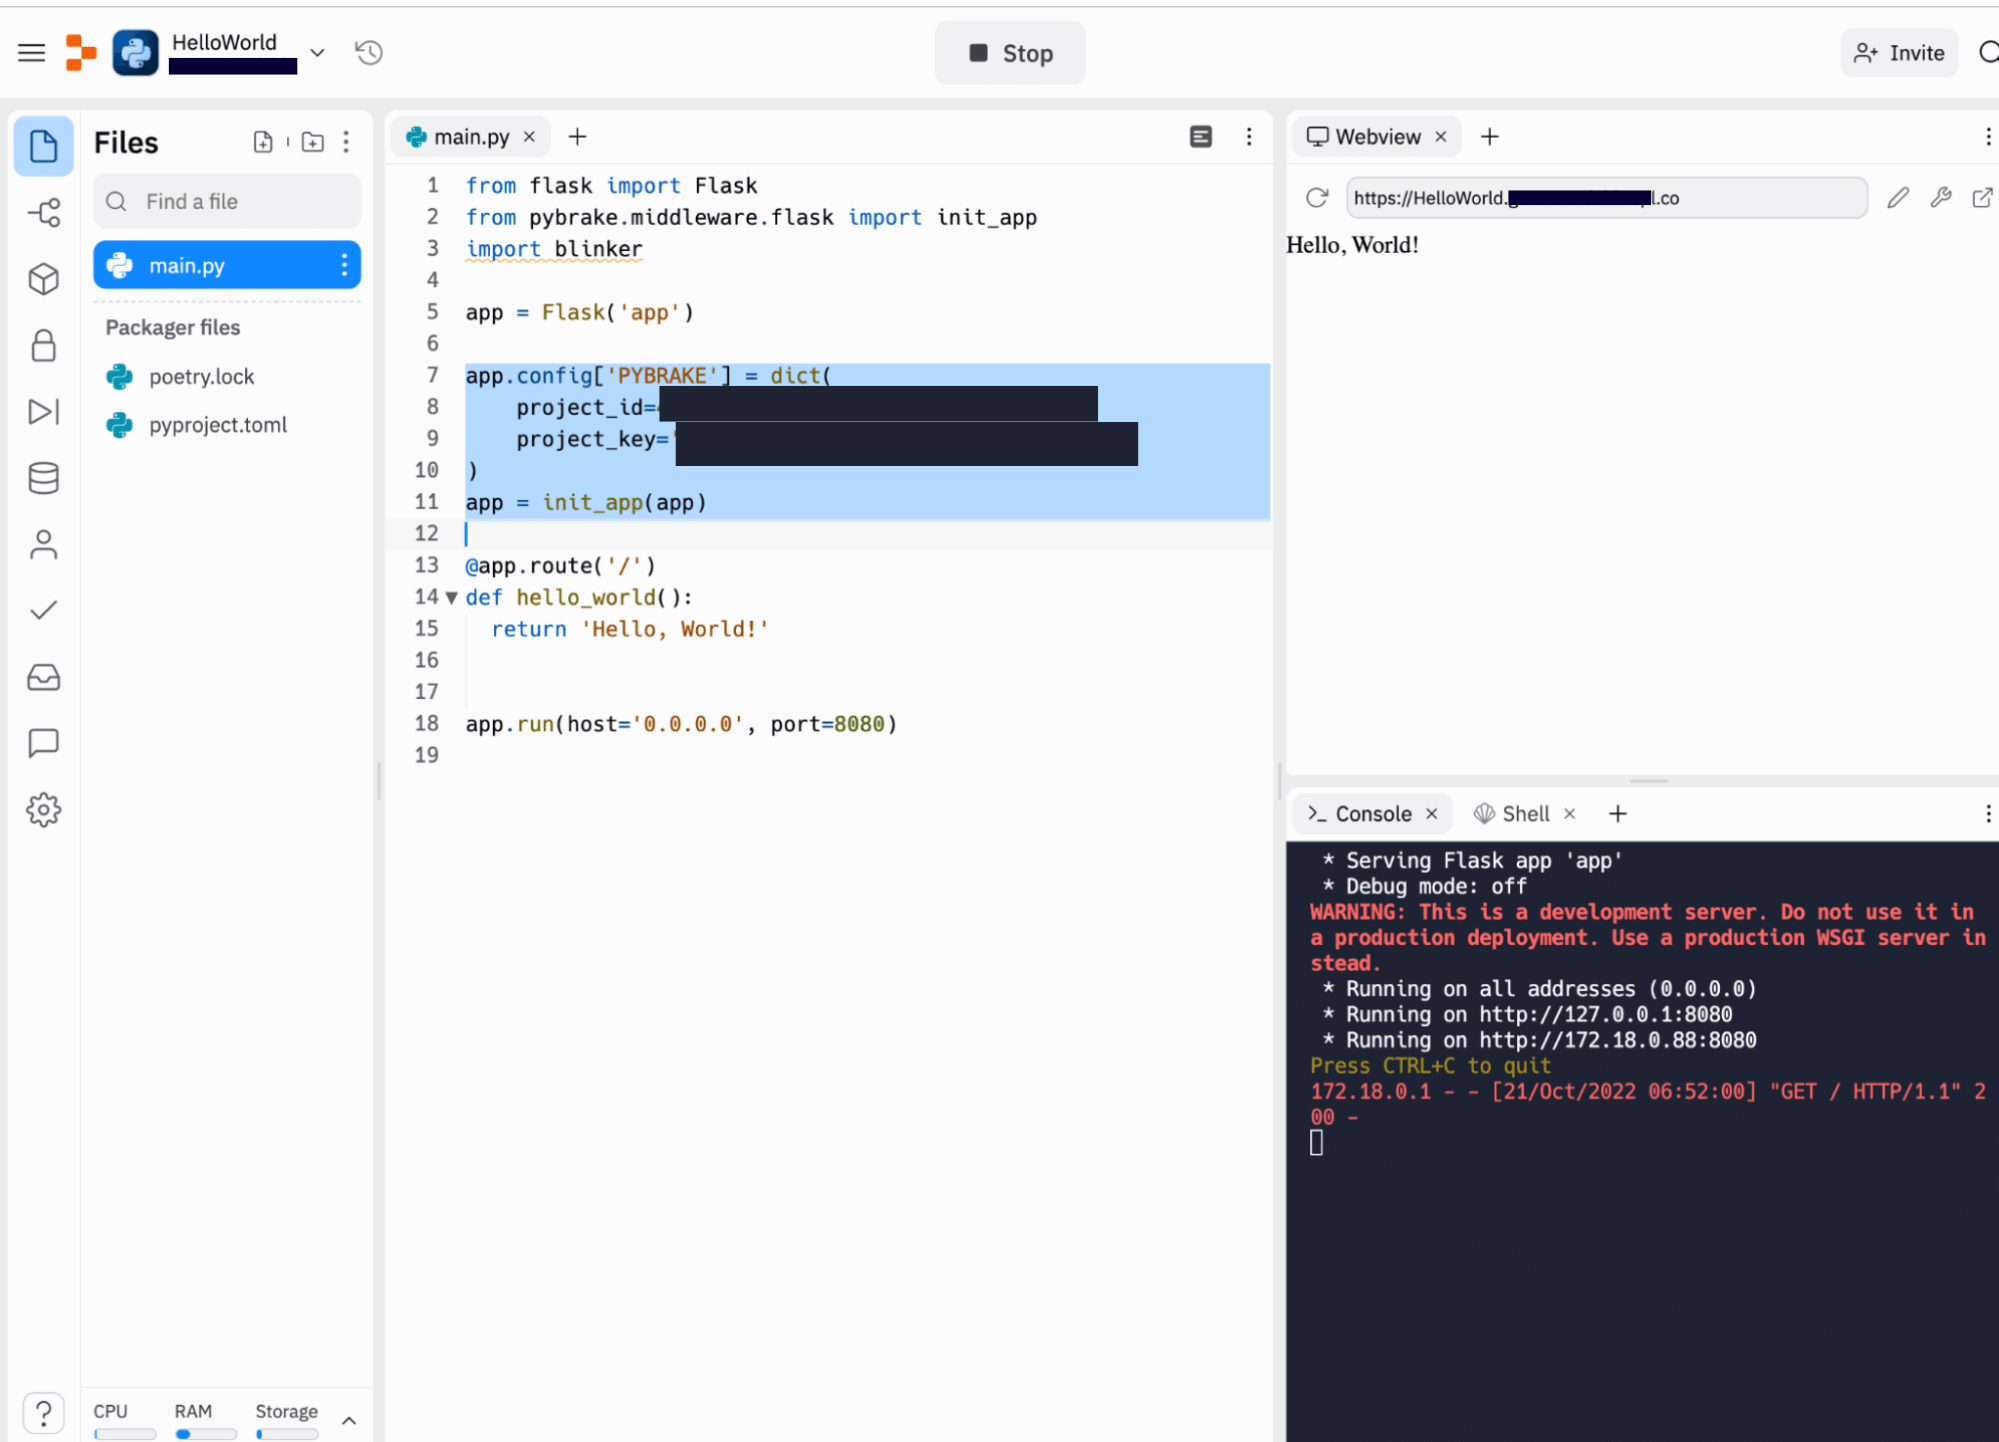
To the left, we see our project files, with main.py being central to our example here. In the middle pane, we see our actual code and, to the right, the application's output as it runs. As we create an HTTP API, we will also see a web browser tab for previewing the API output. Neat 😁
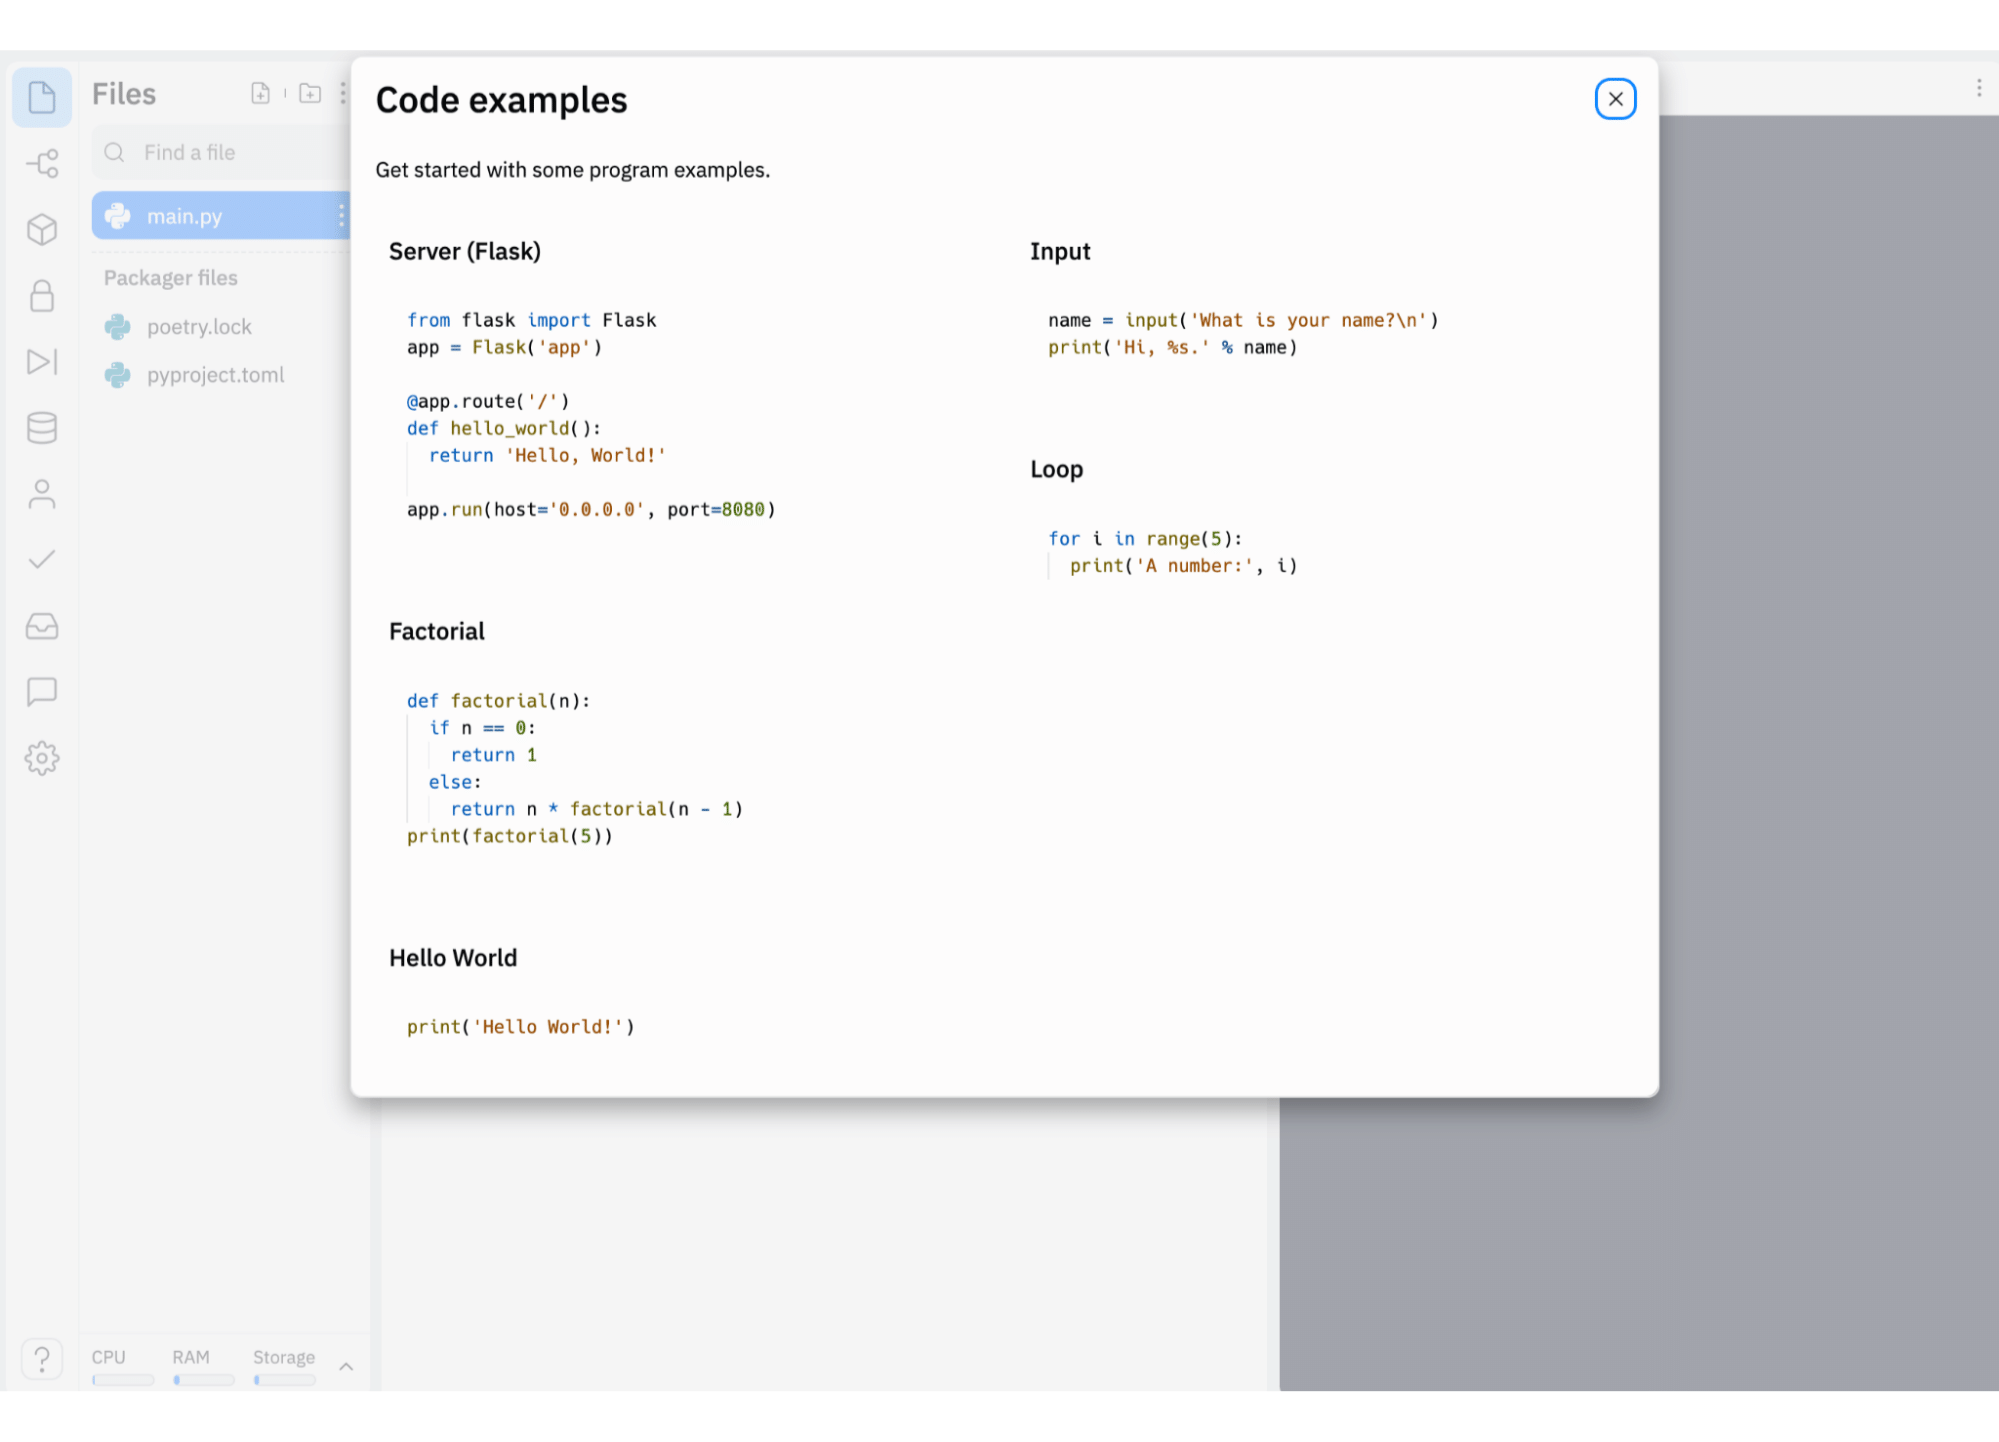
Click on “examples” for a few basic code examples by Replit and choose the Flask option (a very popular framework for building Web APIs). Plus, Airbrake has great support for Flask, which makes the process of installing an error monitoring tool very simple.
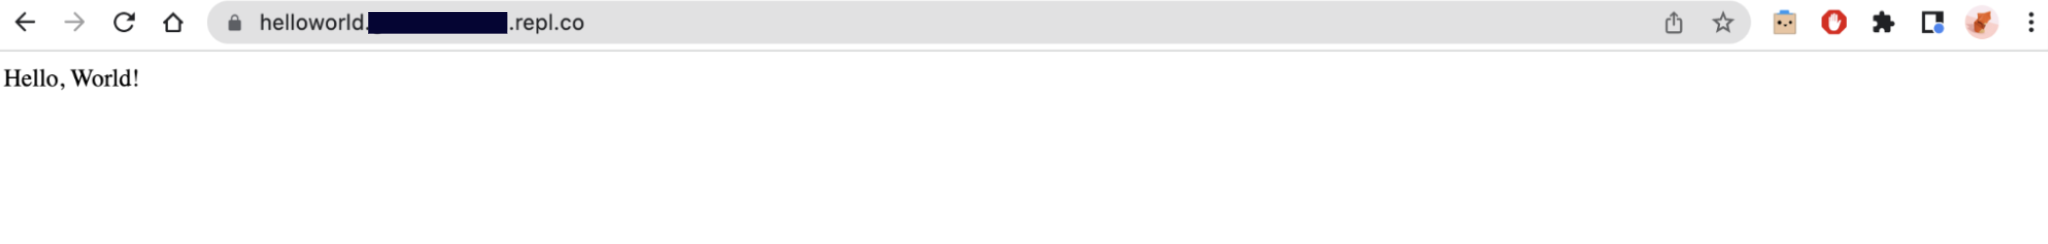
Now the code is in our editor window. Click the big green button that says Run on the top of the screen to run the application. With that, our API is live in the Webview pane, and the console output of the service is below.

We can also browse the service with a browser:
Setting up monitoring with Airbrake
During the entire setup process, monitoring was not a priority. But the moment our API goes live, we need to have a way to see how it’s doing. Is it responsive enough for users? Have any queries gone wrong? Have any errors popped up?
This is where Airbrake comes in handy. Airbrake, once installed, will alert you to any errors and performance issues within your application. Once we identify problems, we can get back to our code again.
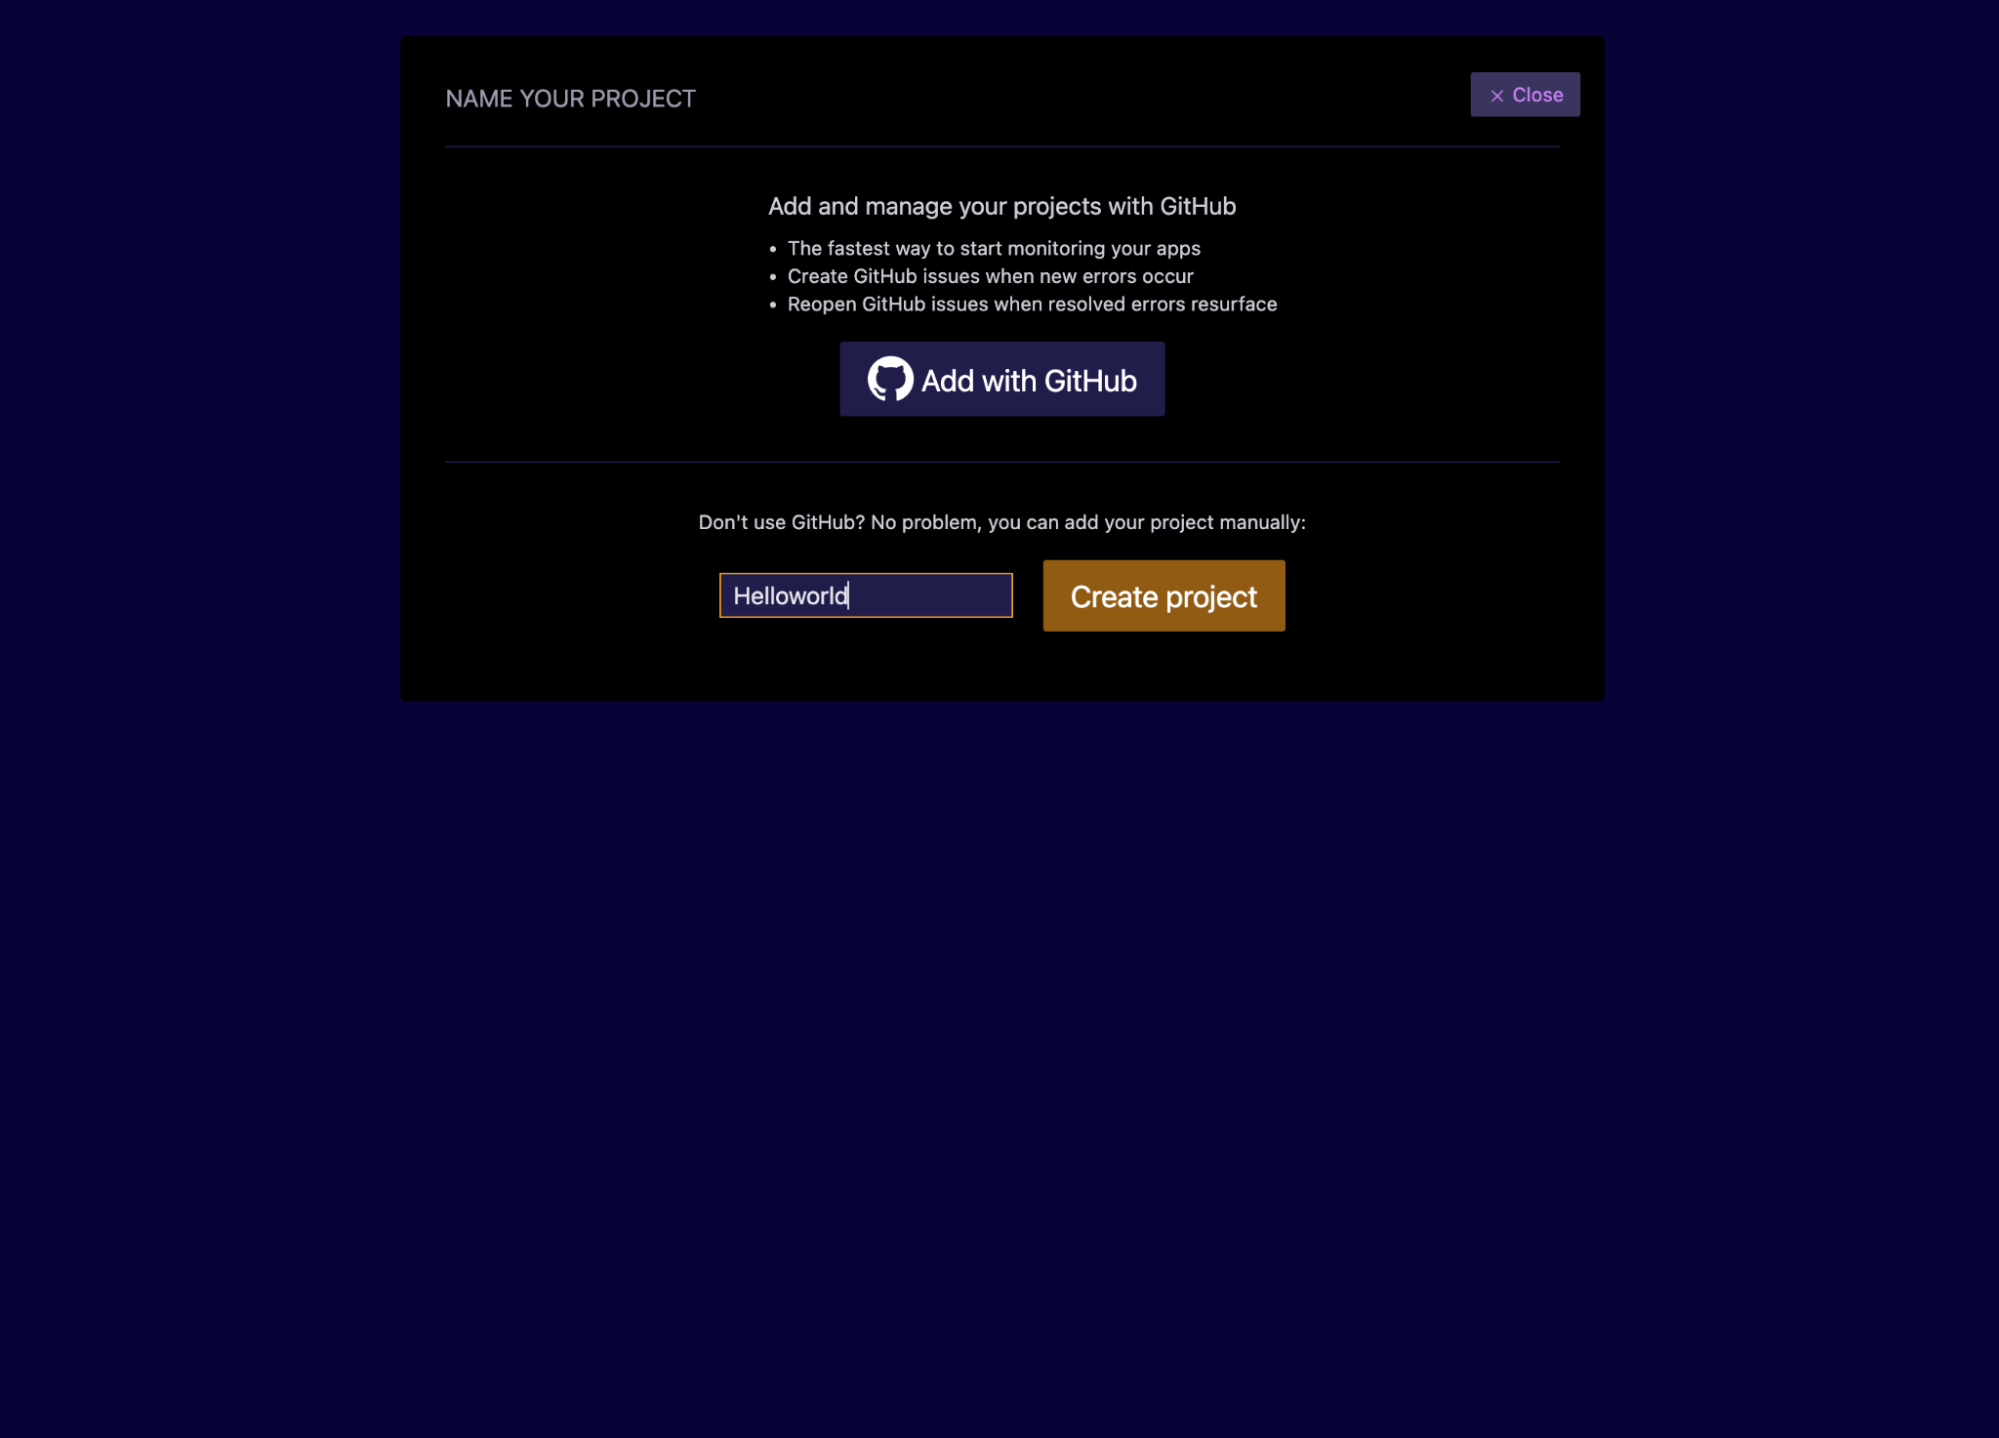
First things first, we need to create an Airbrake account (it’s free for projects like this!), where we’ll be able to create a project for your Replit API, and call it “Helloworld.” In Airbrake, each software project or service is typically its own Airbrake project.
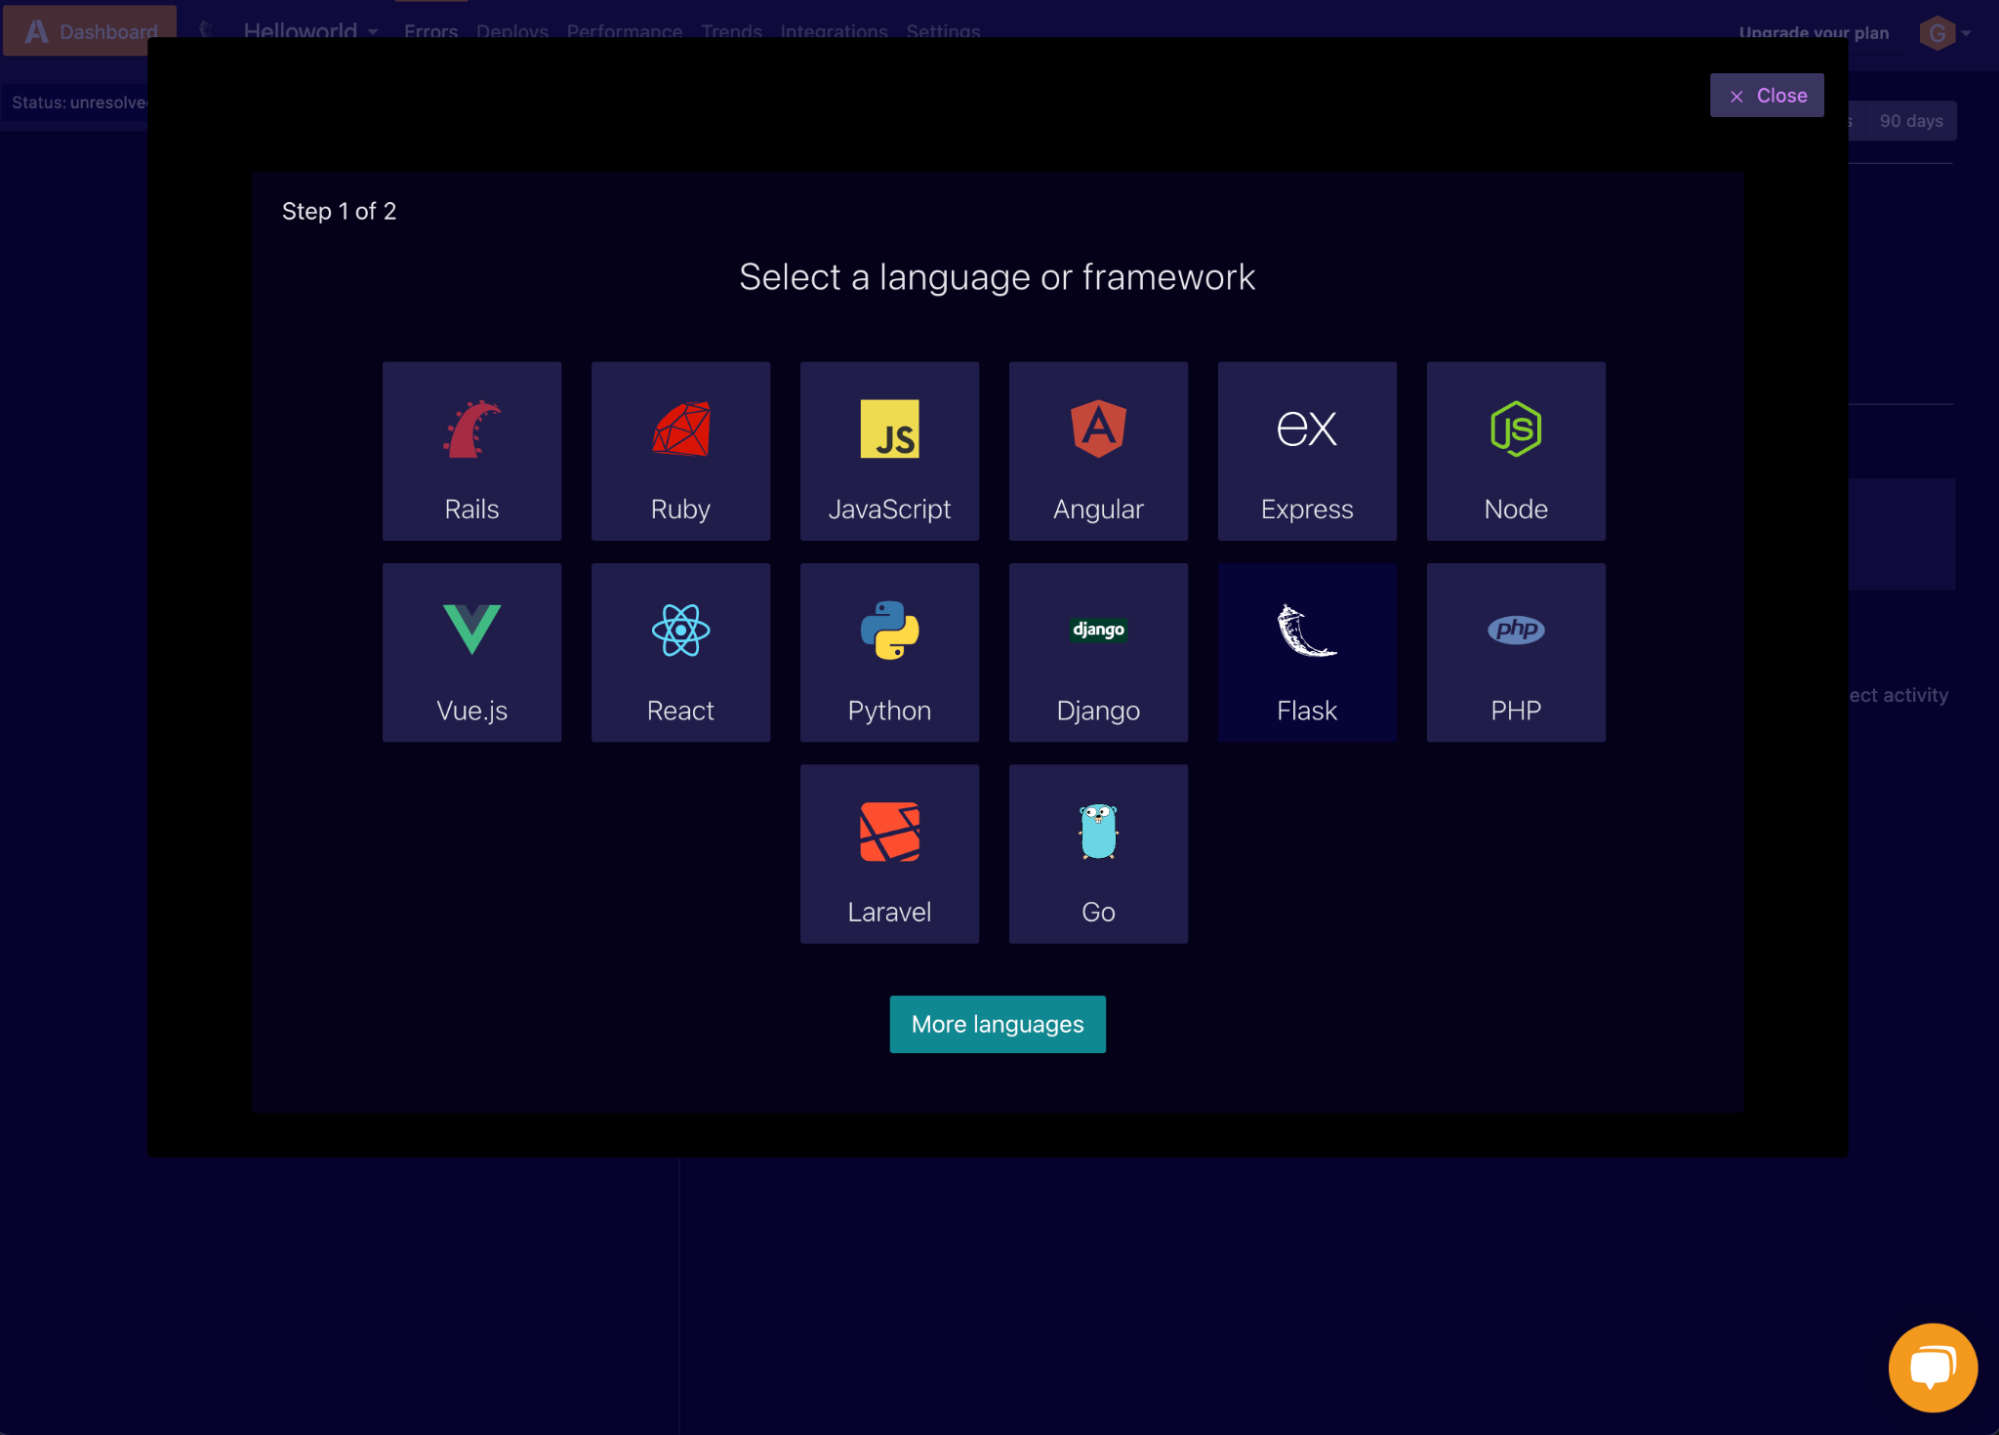
Upon creating the project, we are greeted with a guide to instrument the code we want monitored. Choose Flask, as this is the framework we used in our service. We can quickly set up our monitoring using the Pybrake SDK and follow the Flask instructions. AirbrakeSDKs know how to automatically catch errors and performance events without any error-specific code.
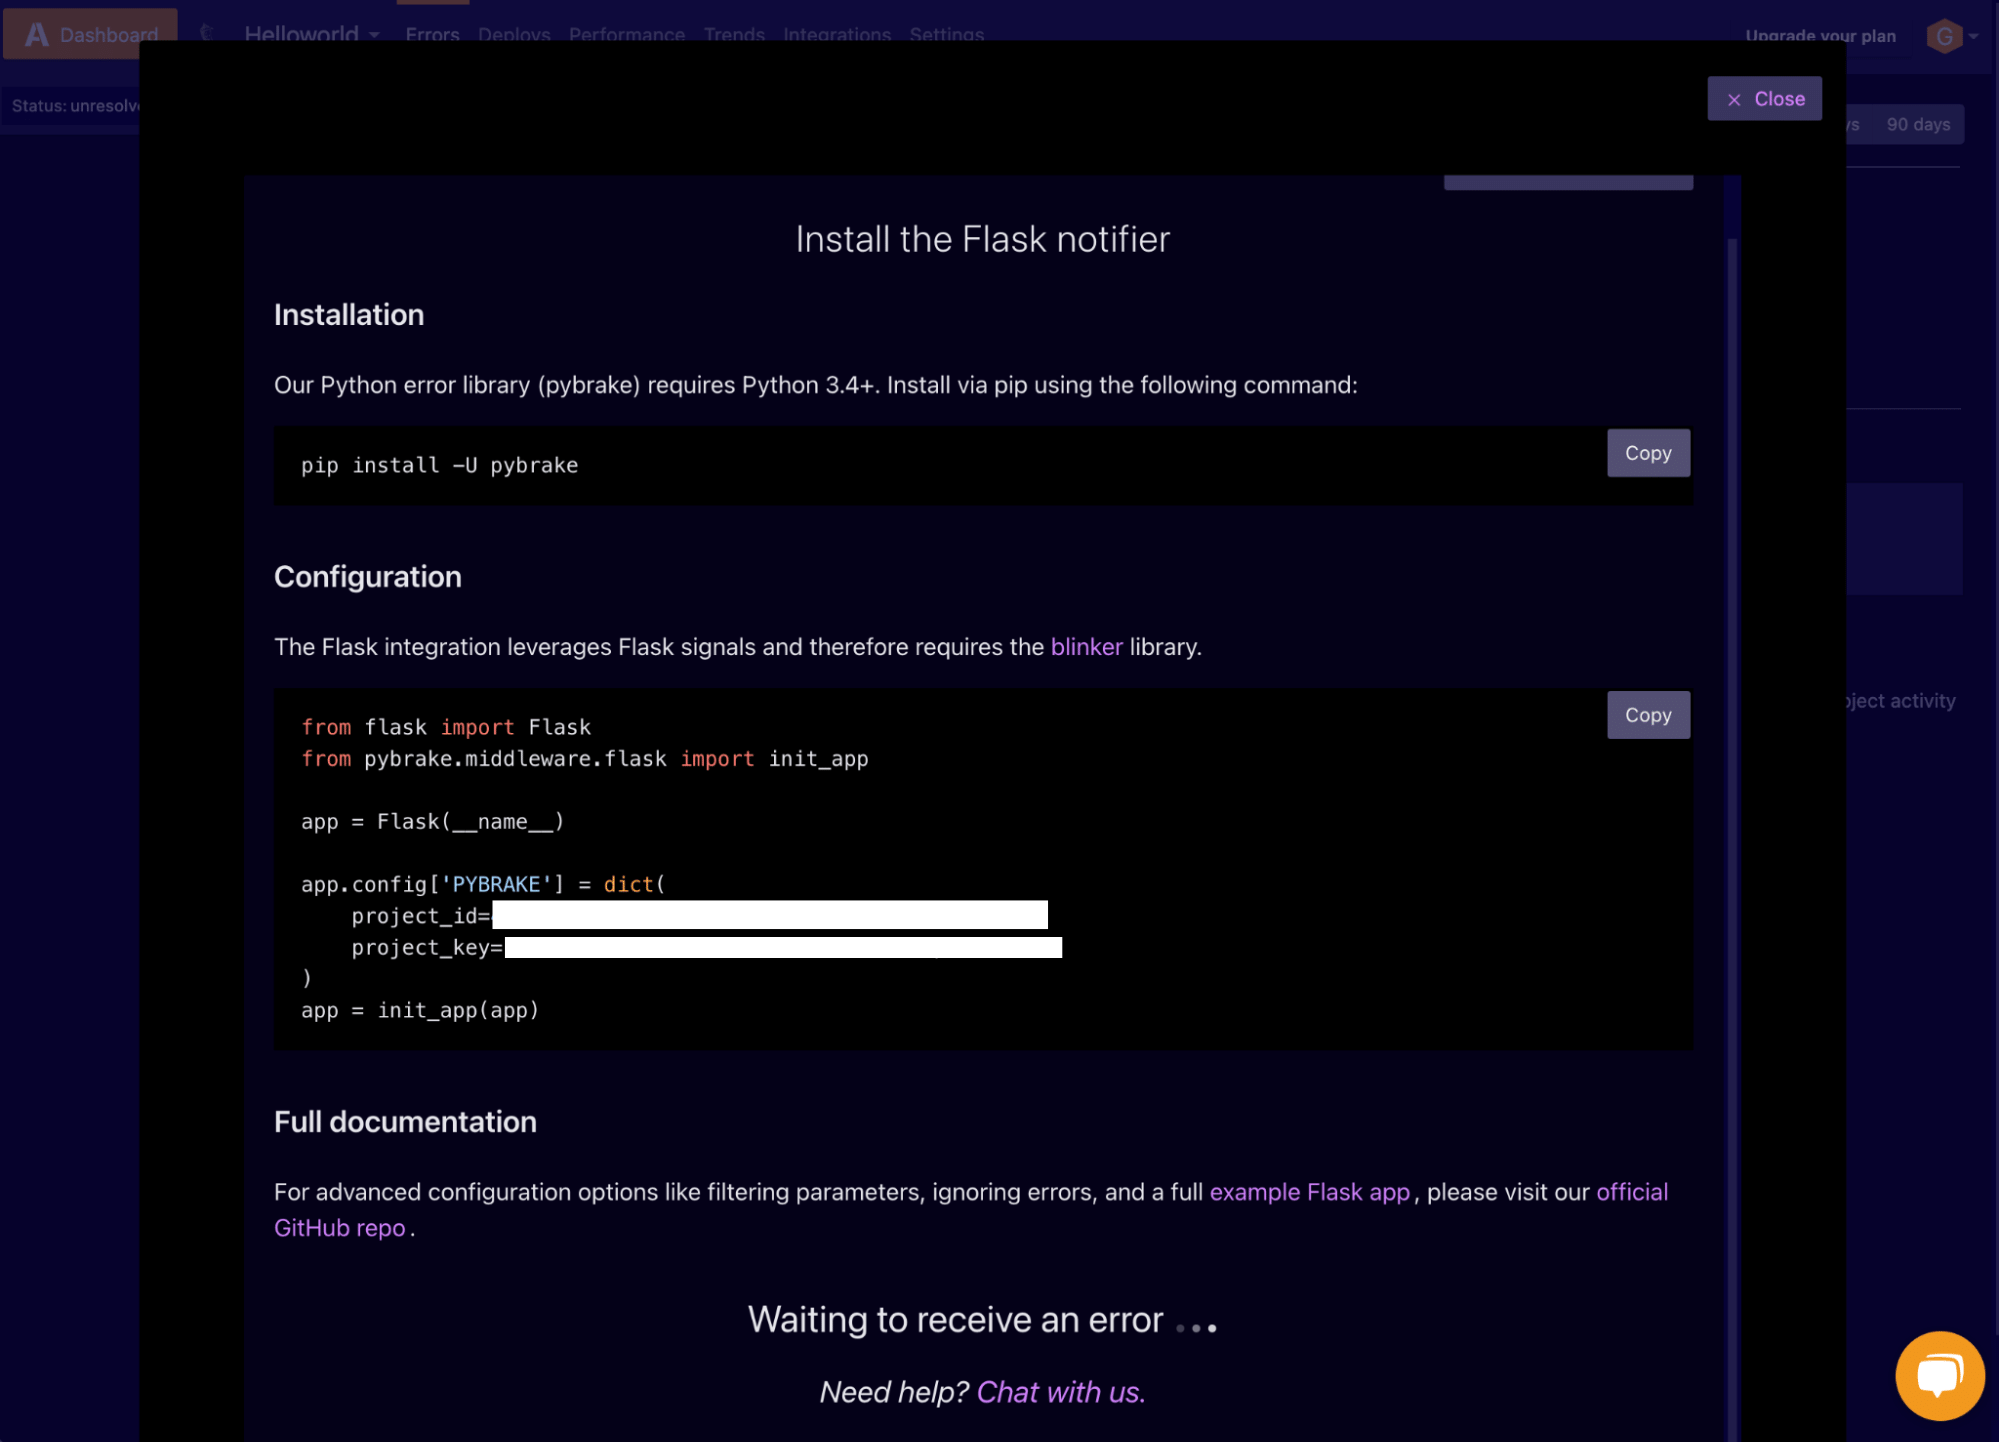
We can see from the instructions that we need to install the pybrake module into our Python environment. Fortunately, this is not needed on Replit, as it will see the imports we used and automatically install the necessary dependencies. We’ll also need to set our Airbrake configuration parameters, so Airbrake knows where to send the errors. You’ll then be able to view these errors within your Airbrake account. Finally, we need to wrap our Flask app object with Pybrake init_app() for it to pick up errors and performance stats.
Let’s do this in Replit.
We start with importing Pybrake. Note that we need to install the blinker library. If you’re not familiar with the blinker library, check out PyPi’s project description about it.
Run the app, so Replit detects these imports and installs them into the environment. Follow the process in the console output in the bottom right of your Replit window.
Once we have imported the Pybrake notifier and installed it, add our Airbrake-specific project configuration and initialize the SDK. Note that this code comes after the actual Flask app initialization.
Run the application again and interact with it. Then head on over to our Airbrake account. We should start seeing performance issues and errors pop up in our Airbrake project. A good way to test this is to hit CTRL+R to refresh the Webview or browse directly to the URL using a browser.
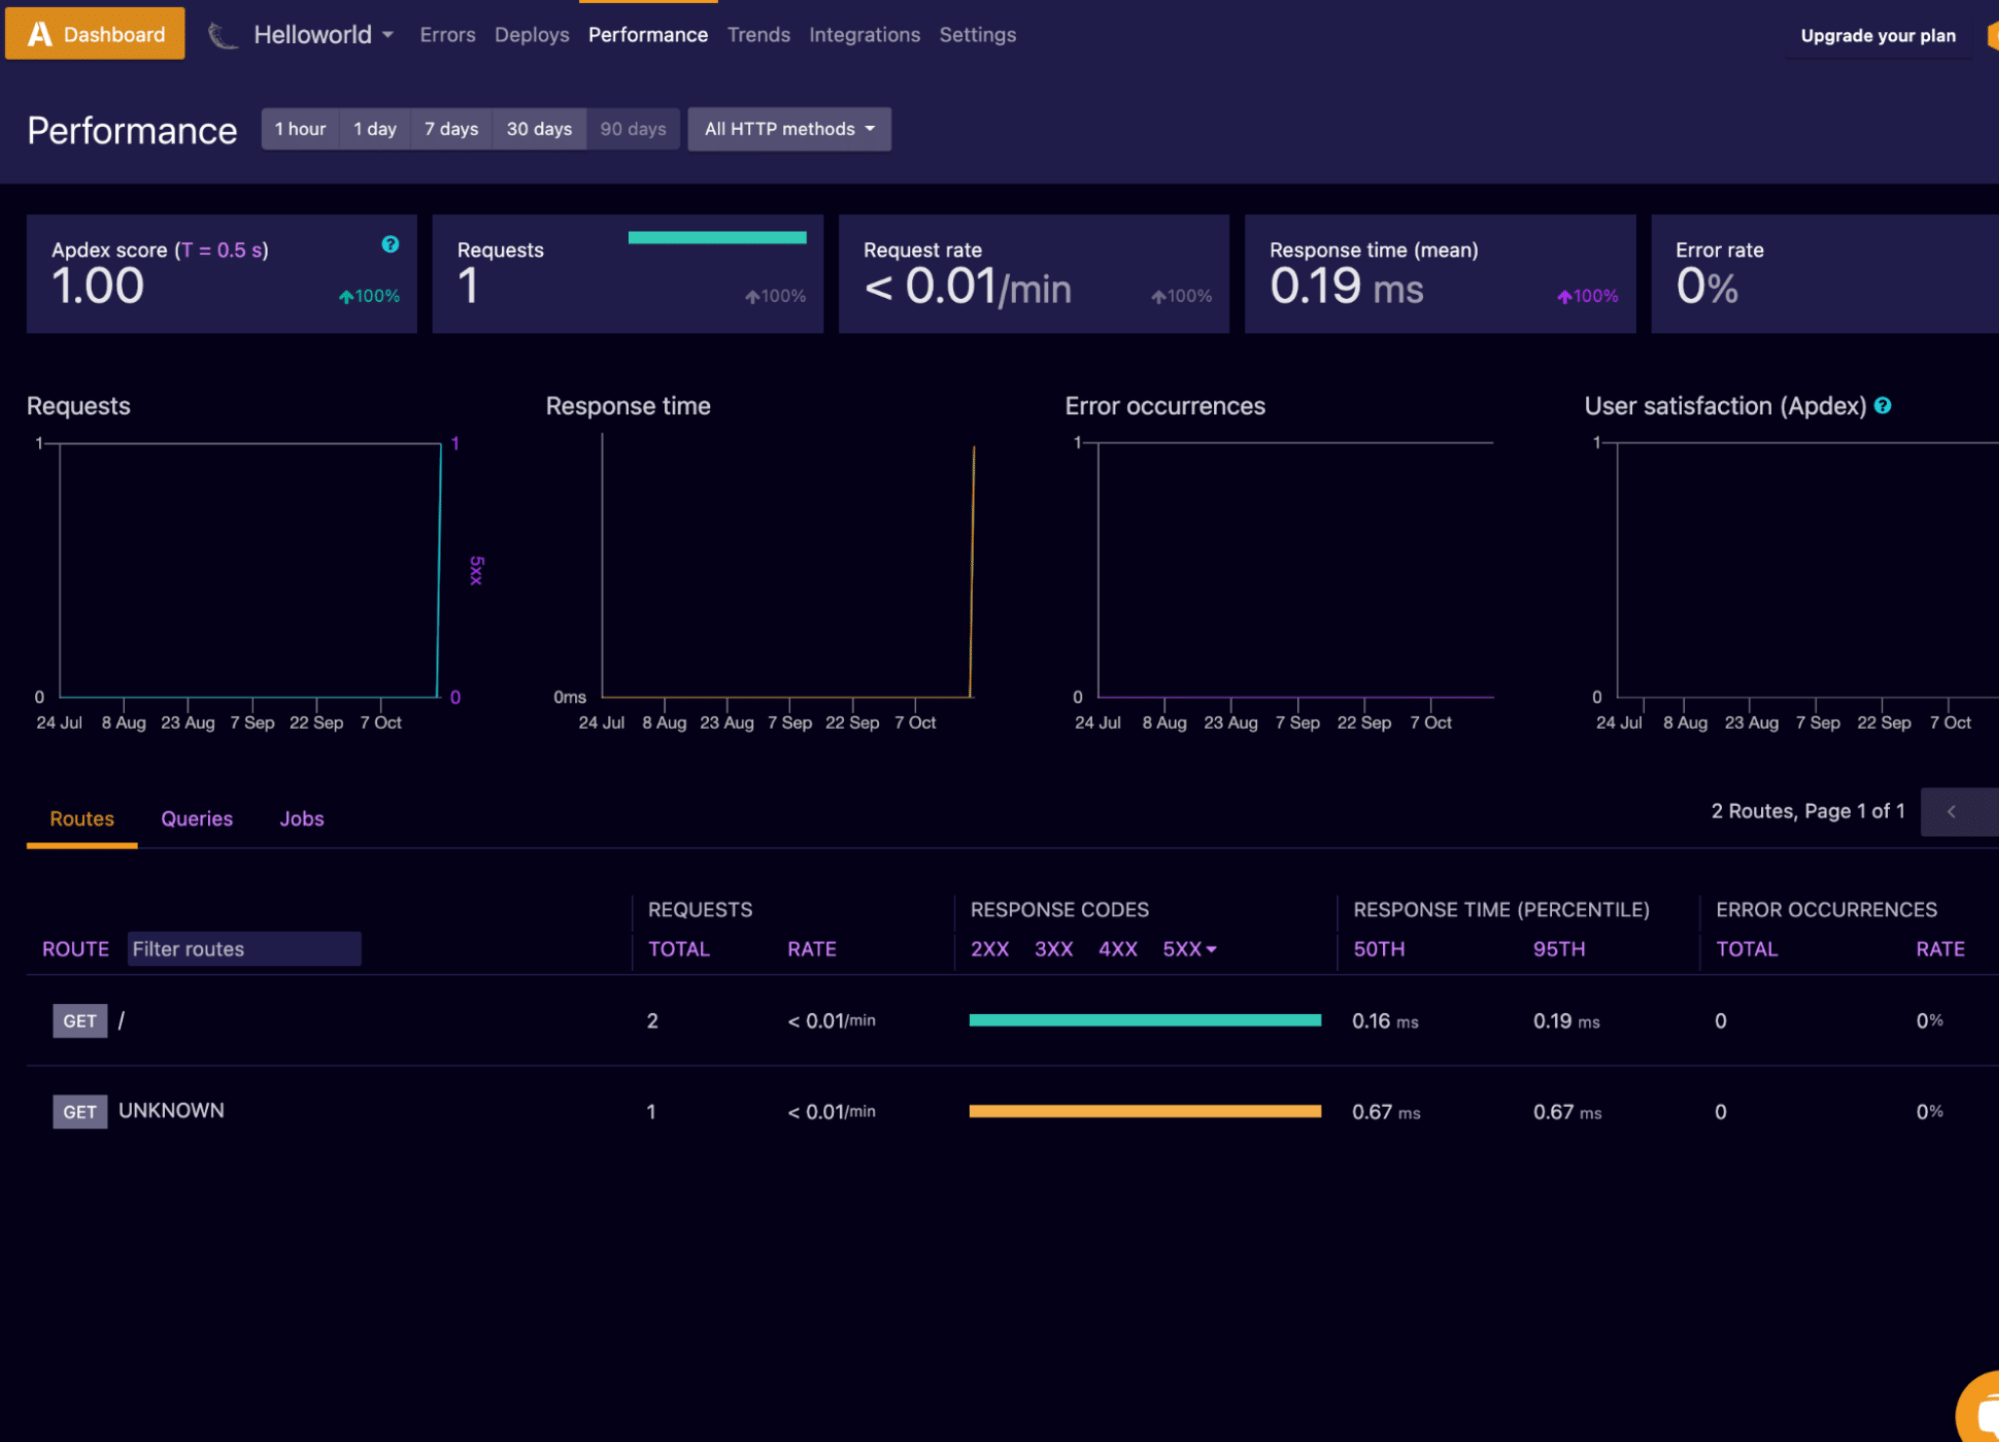
Since we don’t have any errors in this simple code (we think!), we should see performance events first. Every request to the API will generate a performance event with statistics on response time.
We go to the Performance tab in Airbrake to see that we indeed have 1 request with a response time of 0.19 ms and no errors. From this view, we can see the different routes that have been identified. The most important one for us is the " / "route, which is the root of our API and the one we query by default.
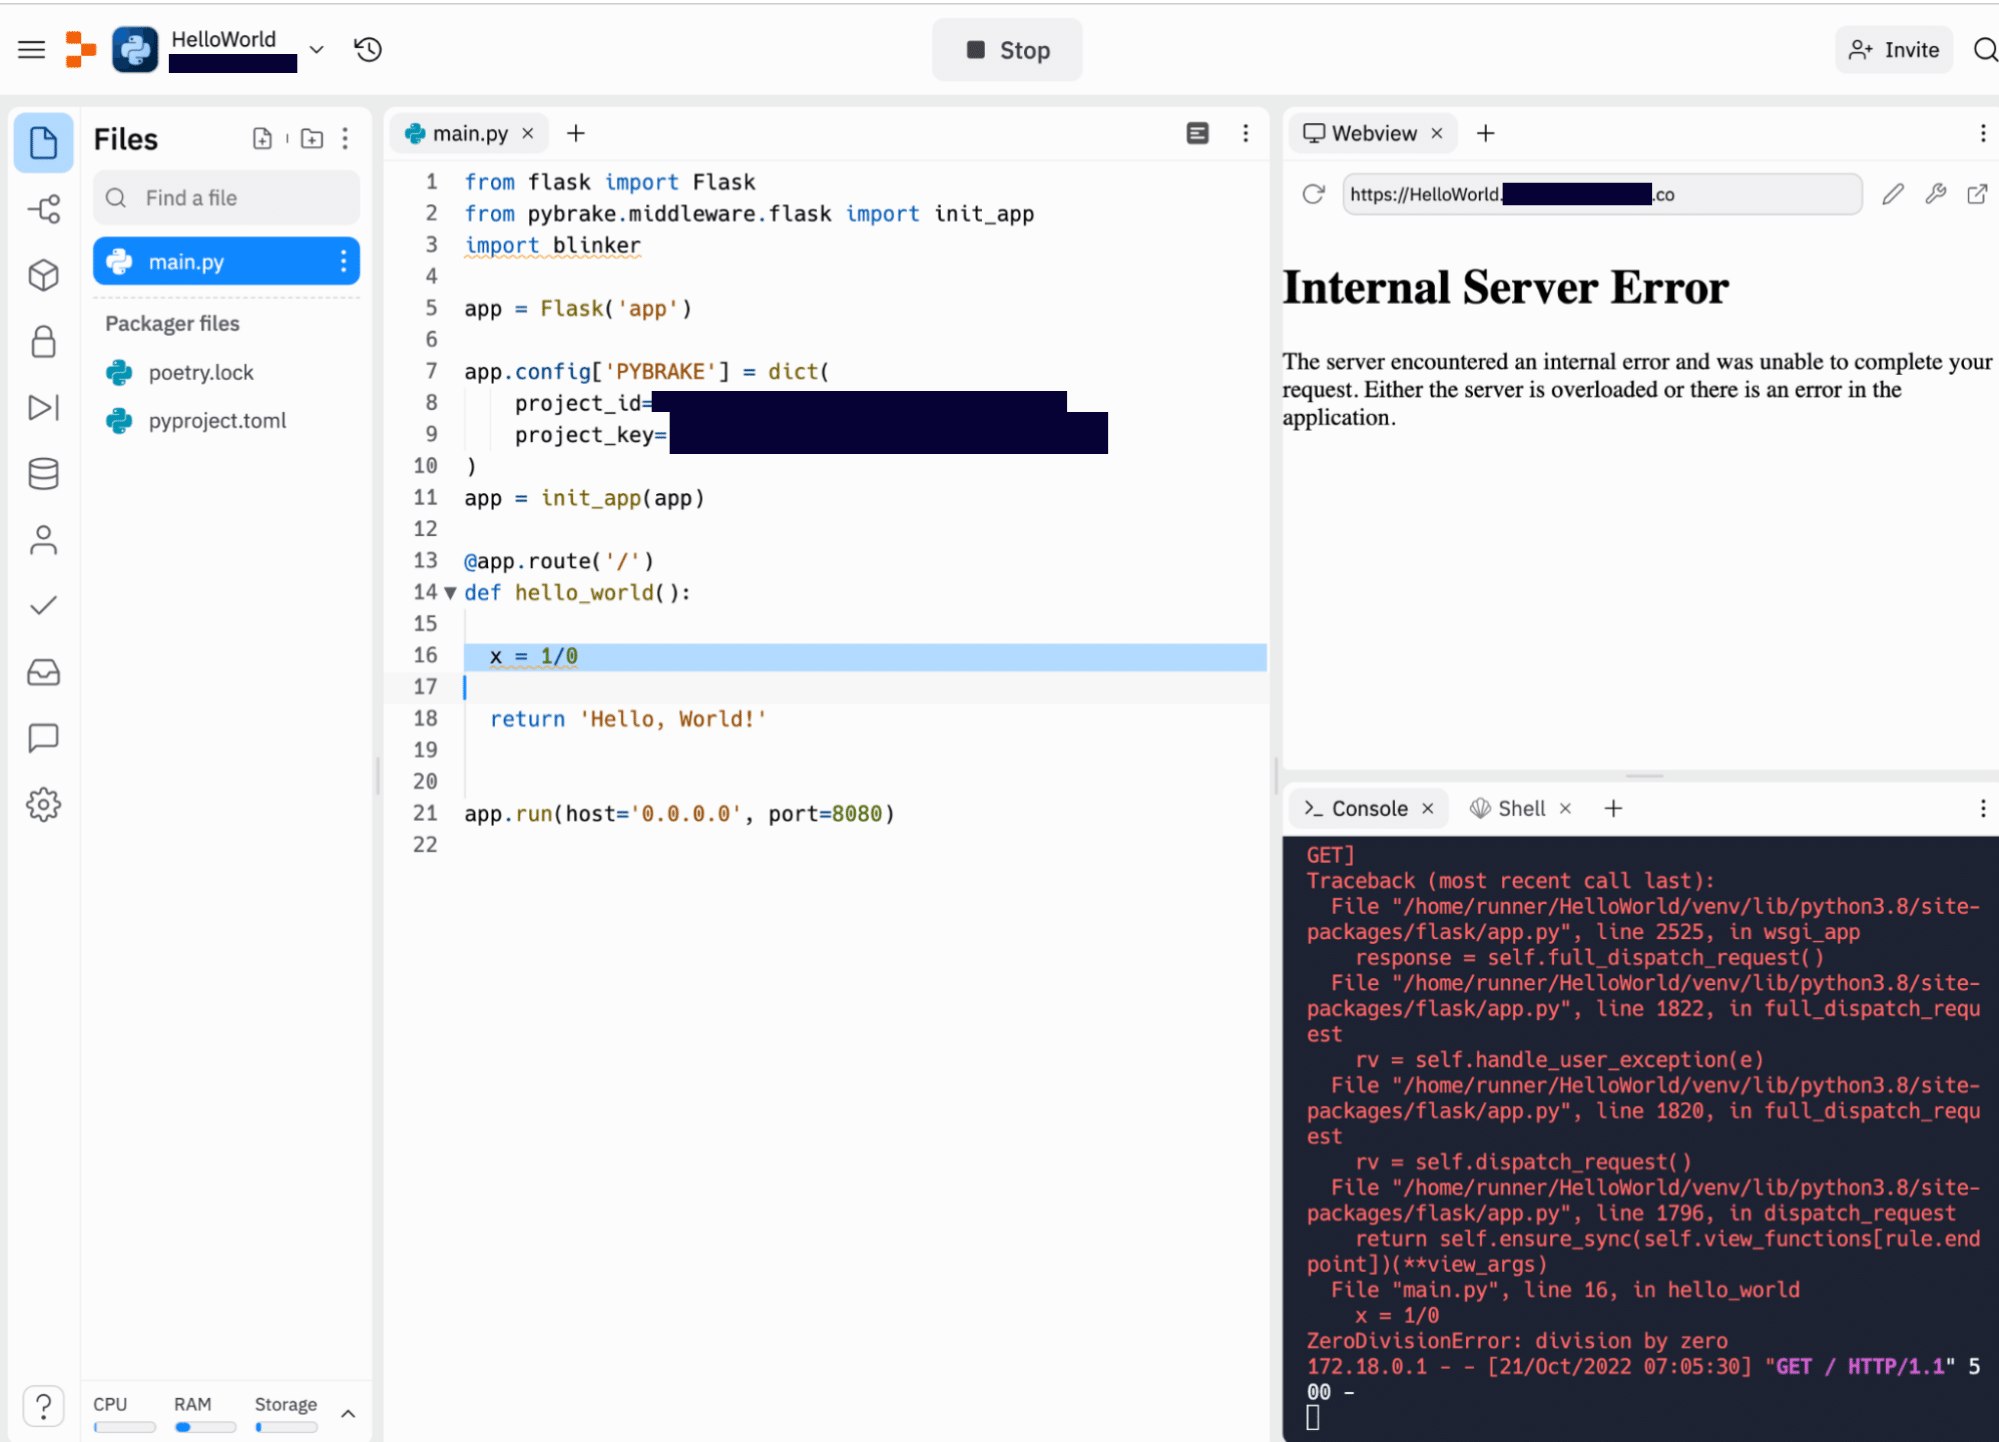
We now want to see how errors manifest themselves in Airbrake. All we have to do is create an error in our code. The easiest way to do this is to add a simple division by zero problem (x = 1/0) within our hello world API function. This will trigger an error when the API is queried.
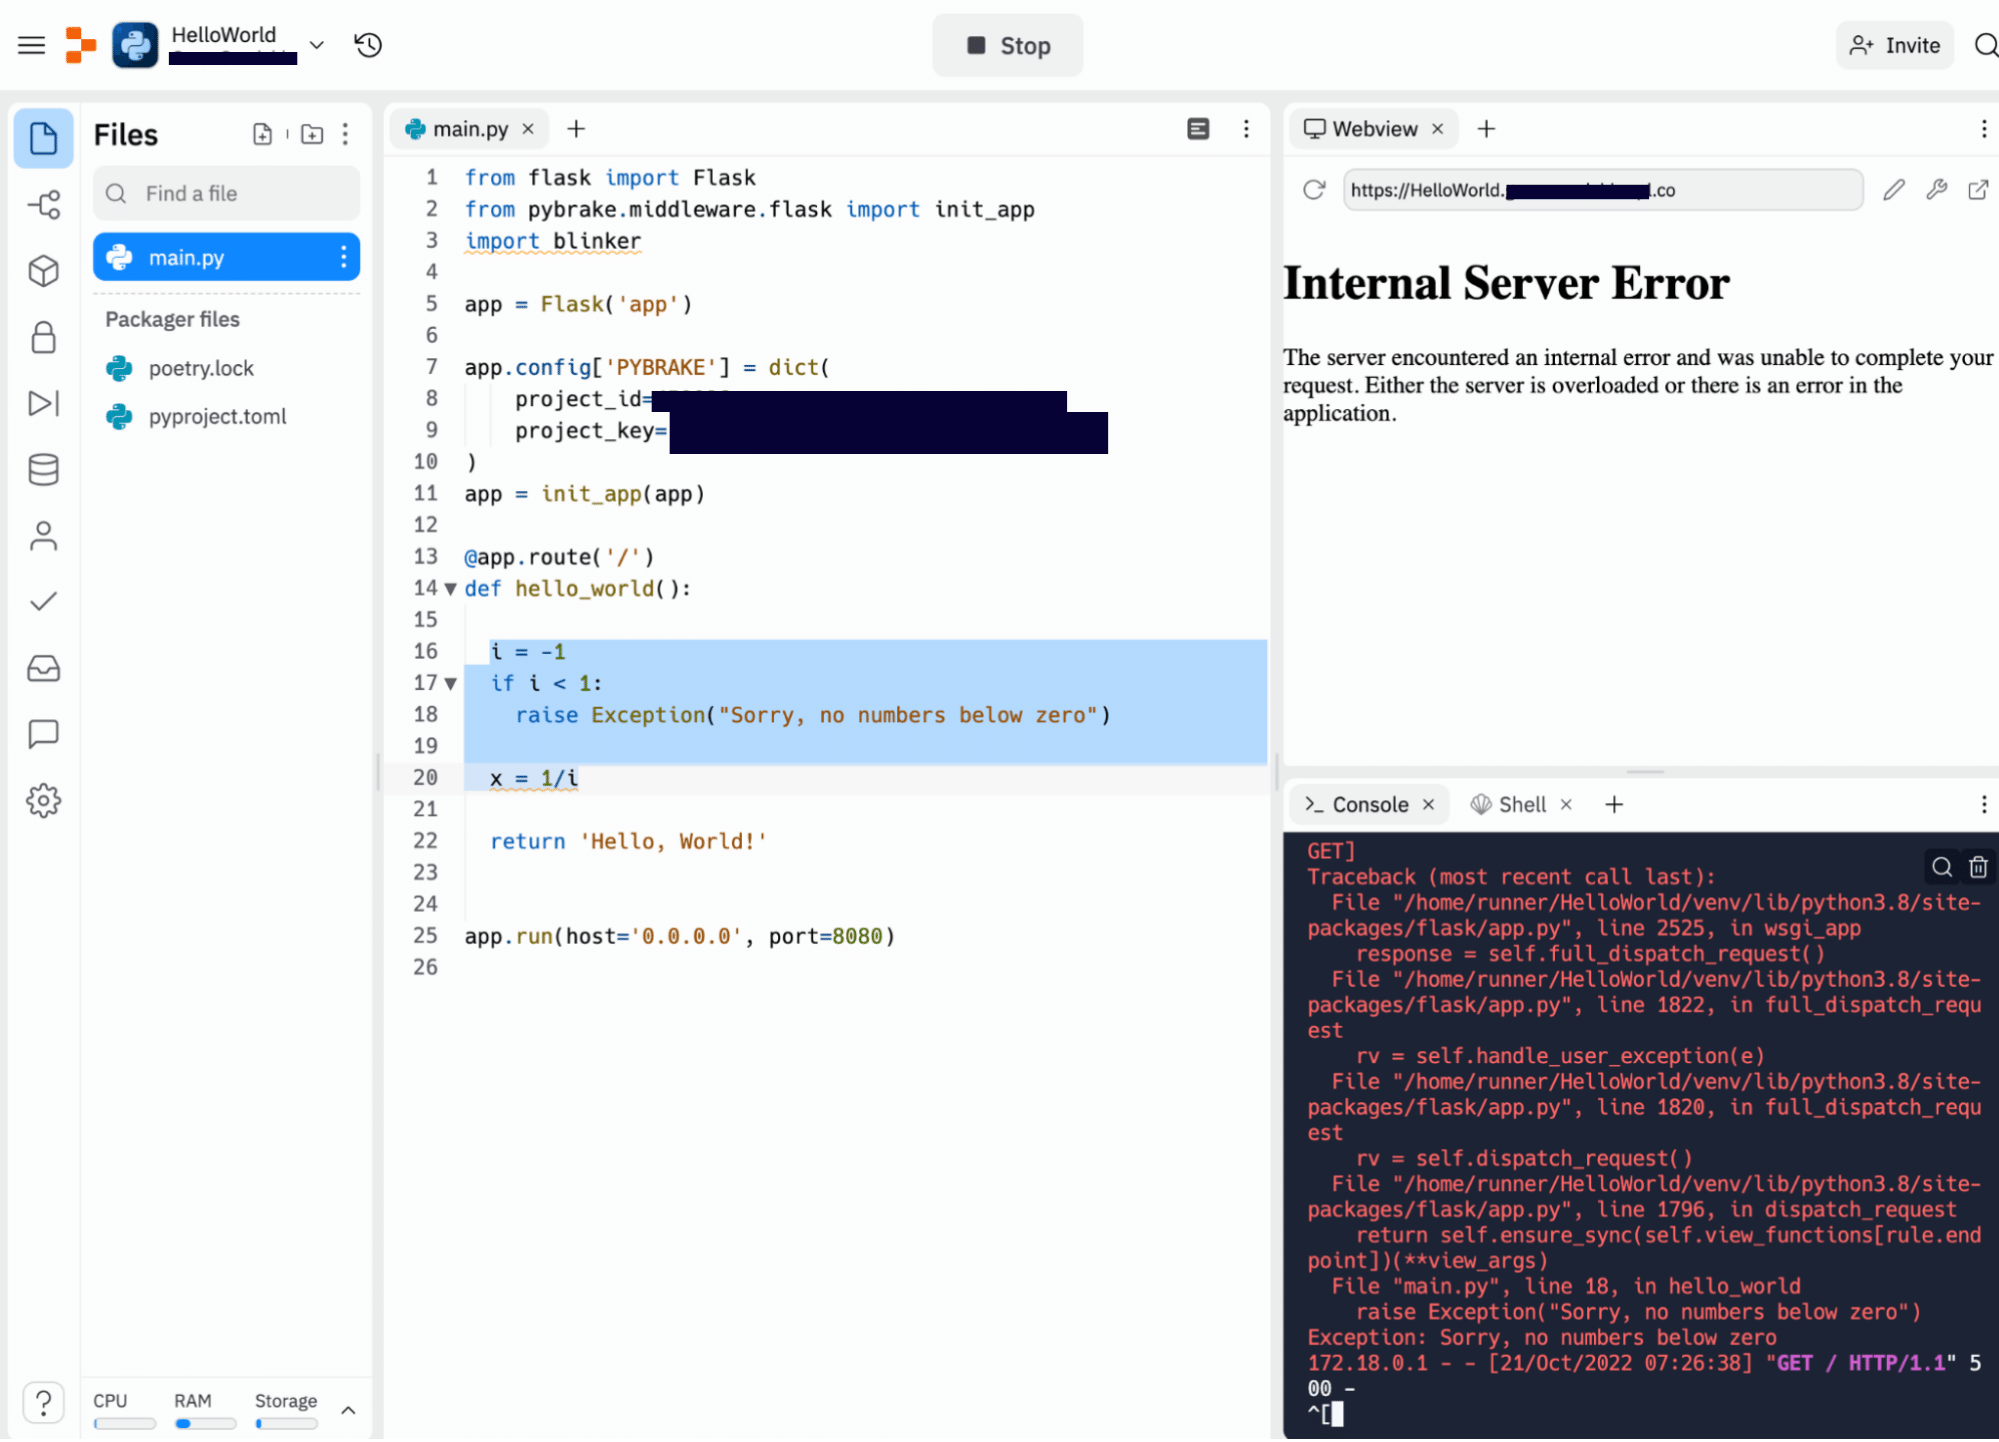
Run the code again, and you’ll see an Internal Server Error within the Webview. Our division by zero problem broke the request. We can also see this in the console output.
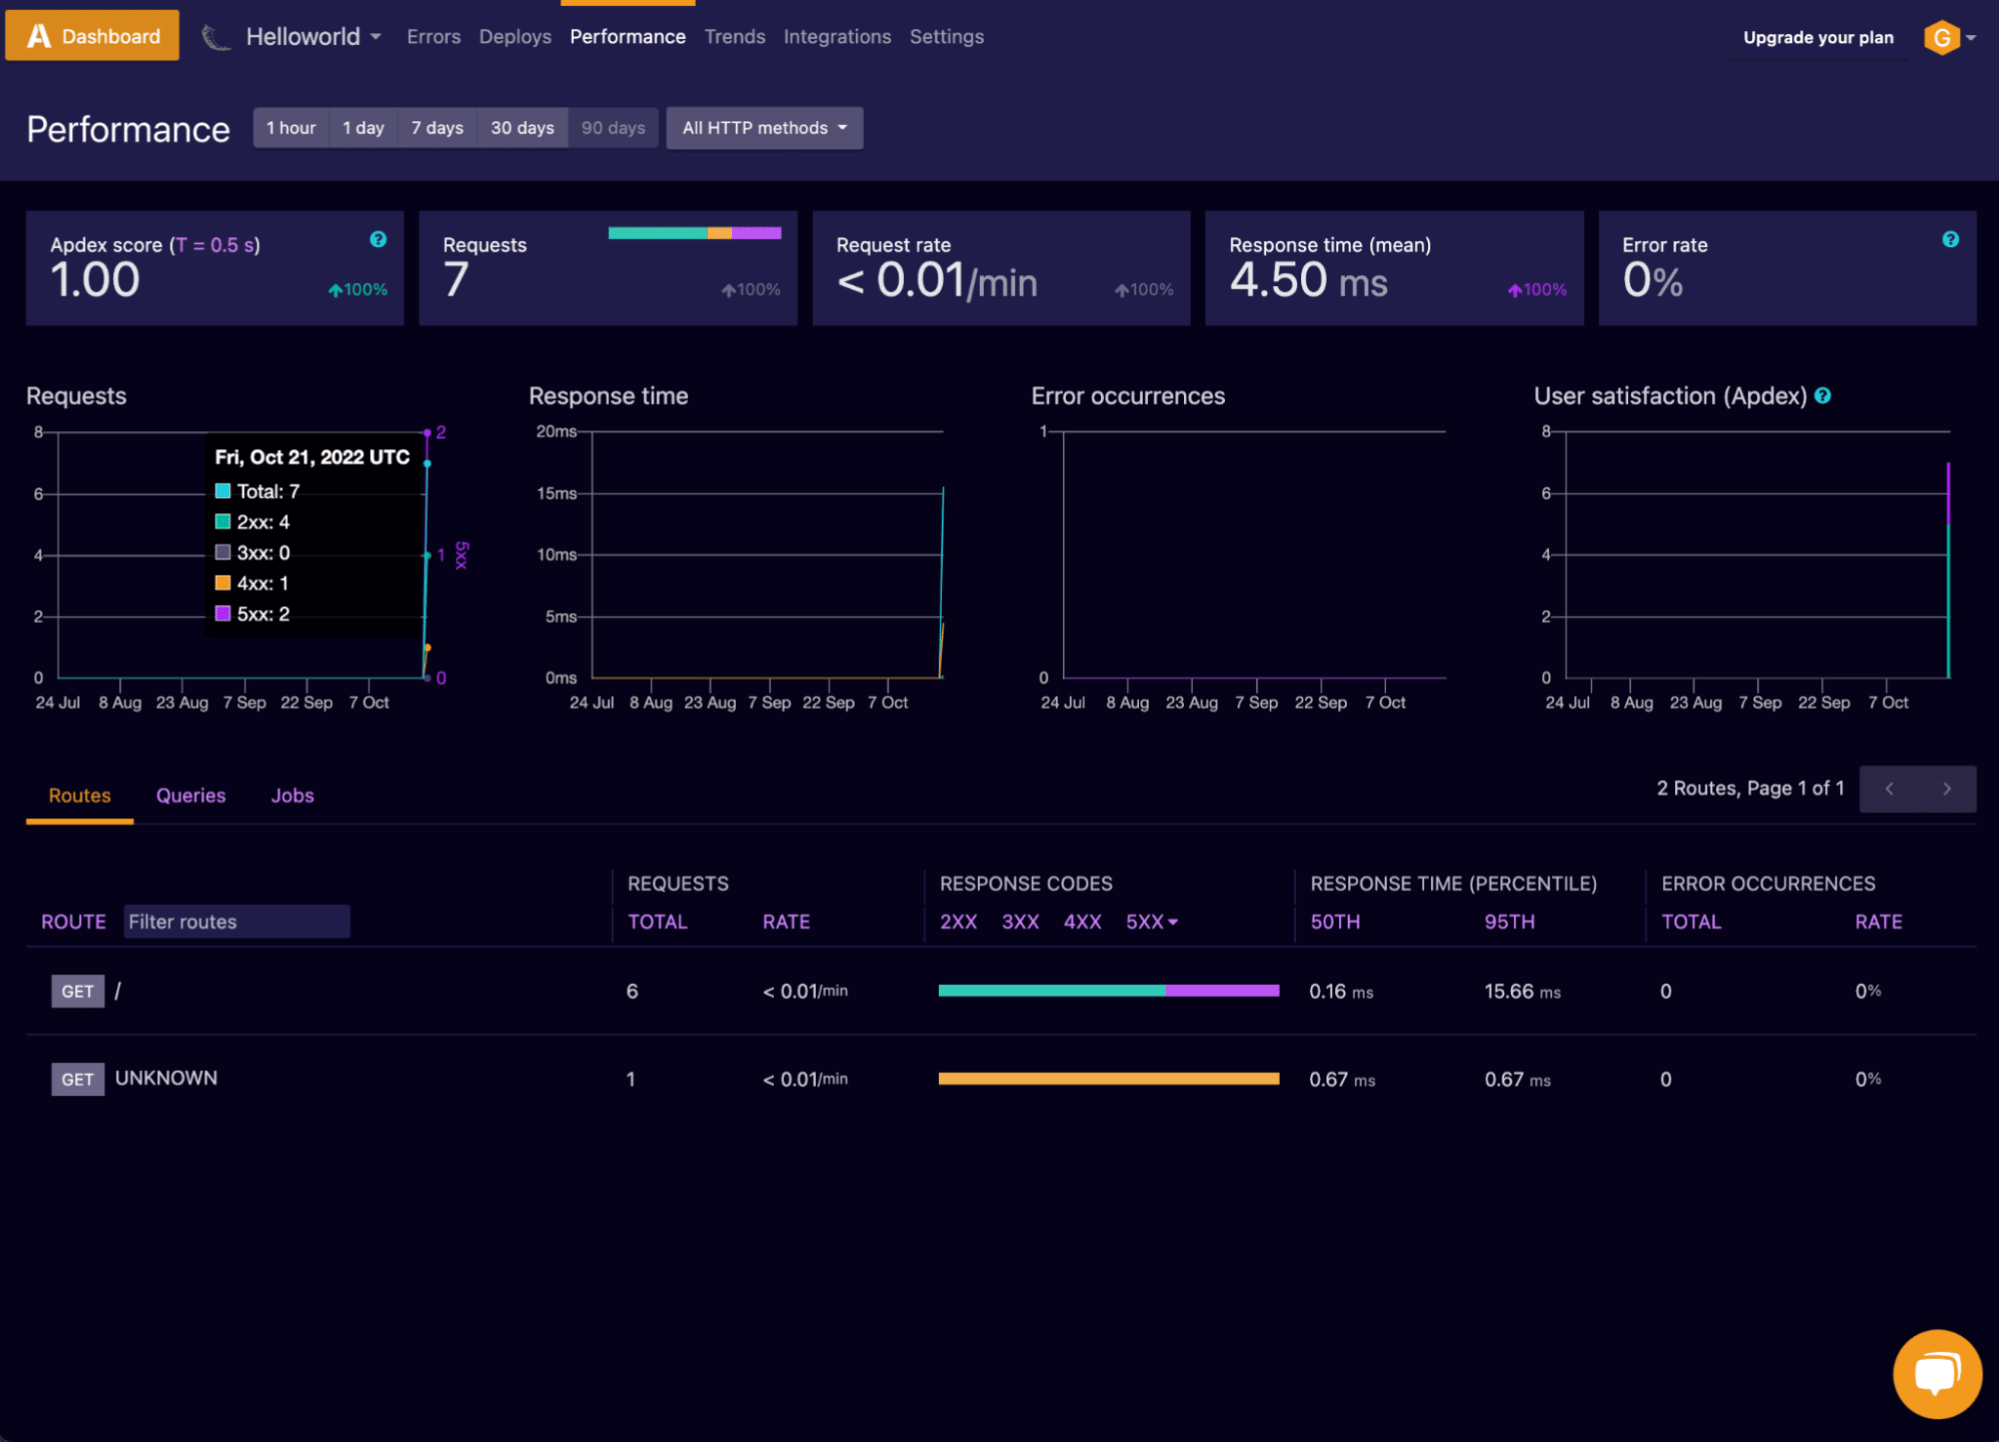
Take a look at the performance view in Airbrake. There should be a request that issues a 500 Response Code (internal server error).
Often, frameworks use generic error messages, but since this is a known bug in our application, we may want to capture it better.
In Replit, add a condition that captures this problem, and raise a new Exception that more clearly describes the problem for us. The bug still causes the same problem when querying the API, but now it will raise an Exception that says, “Sorry, no numbers below zero.”
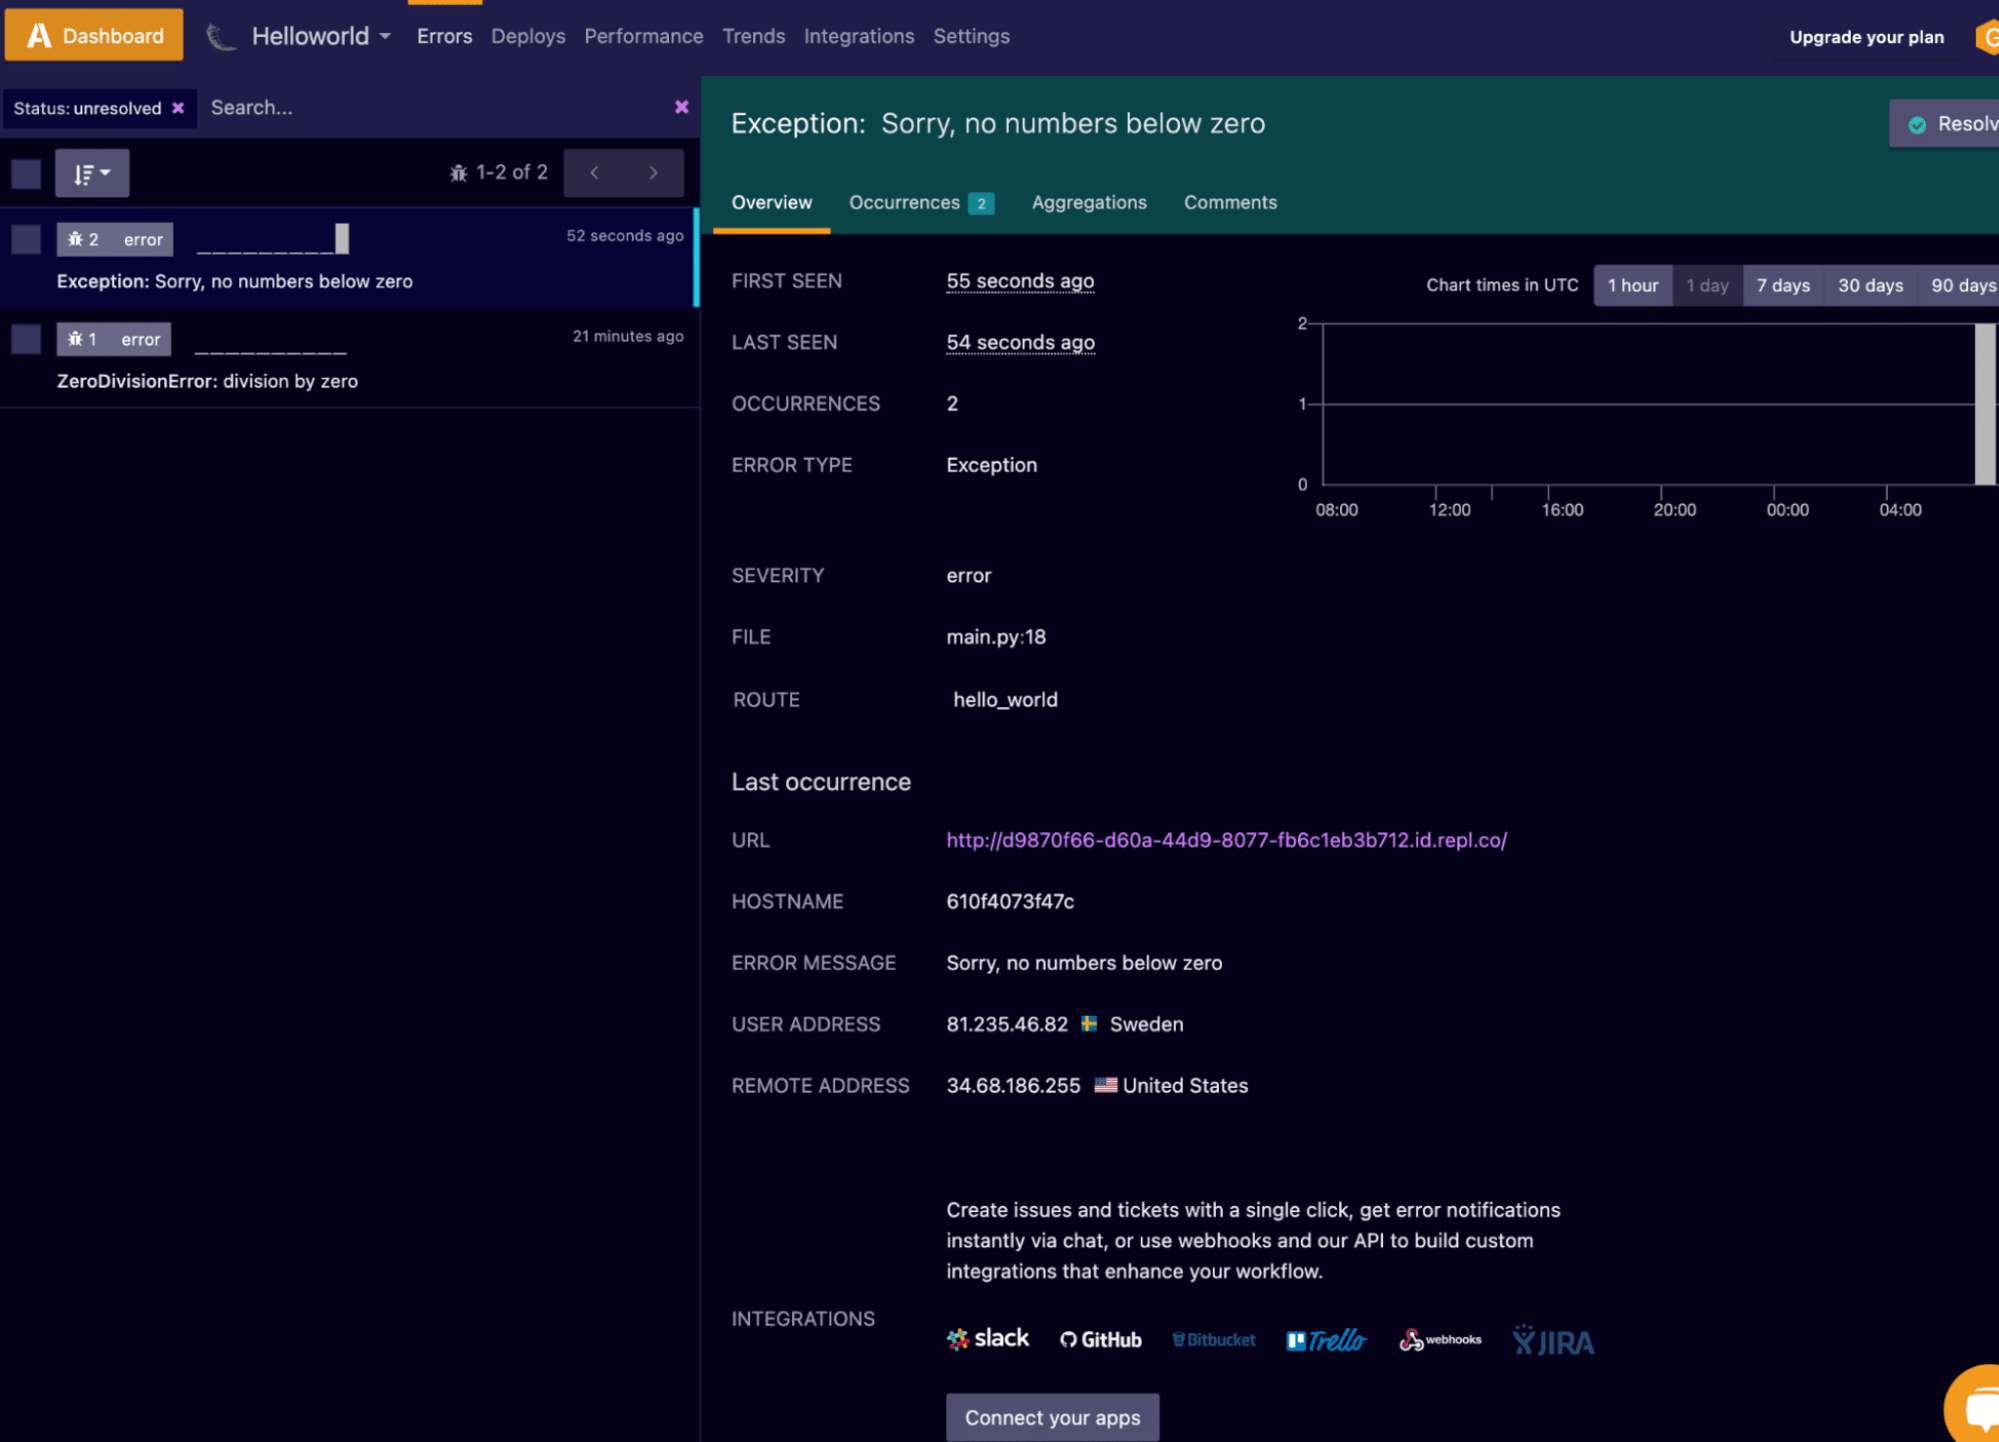
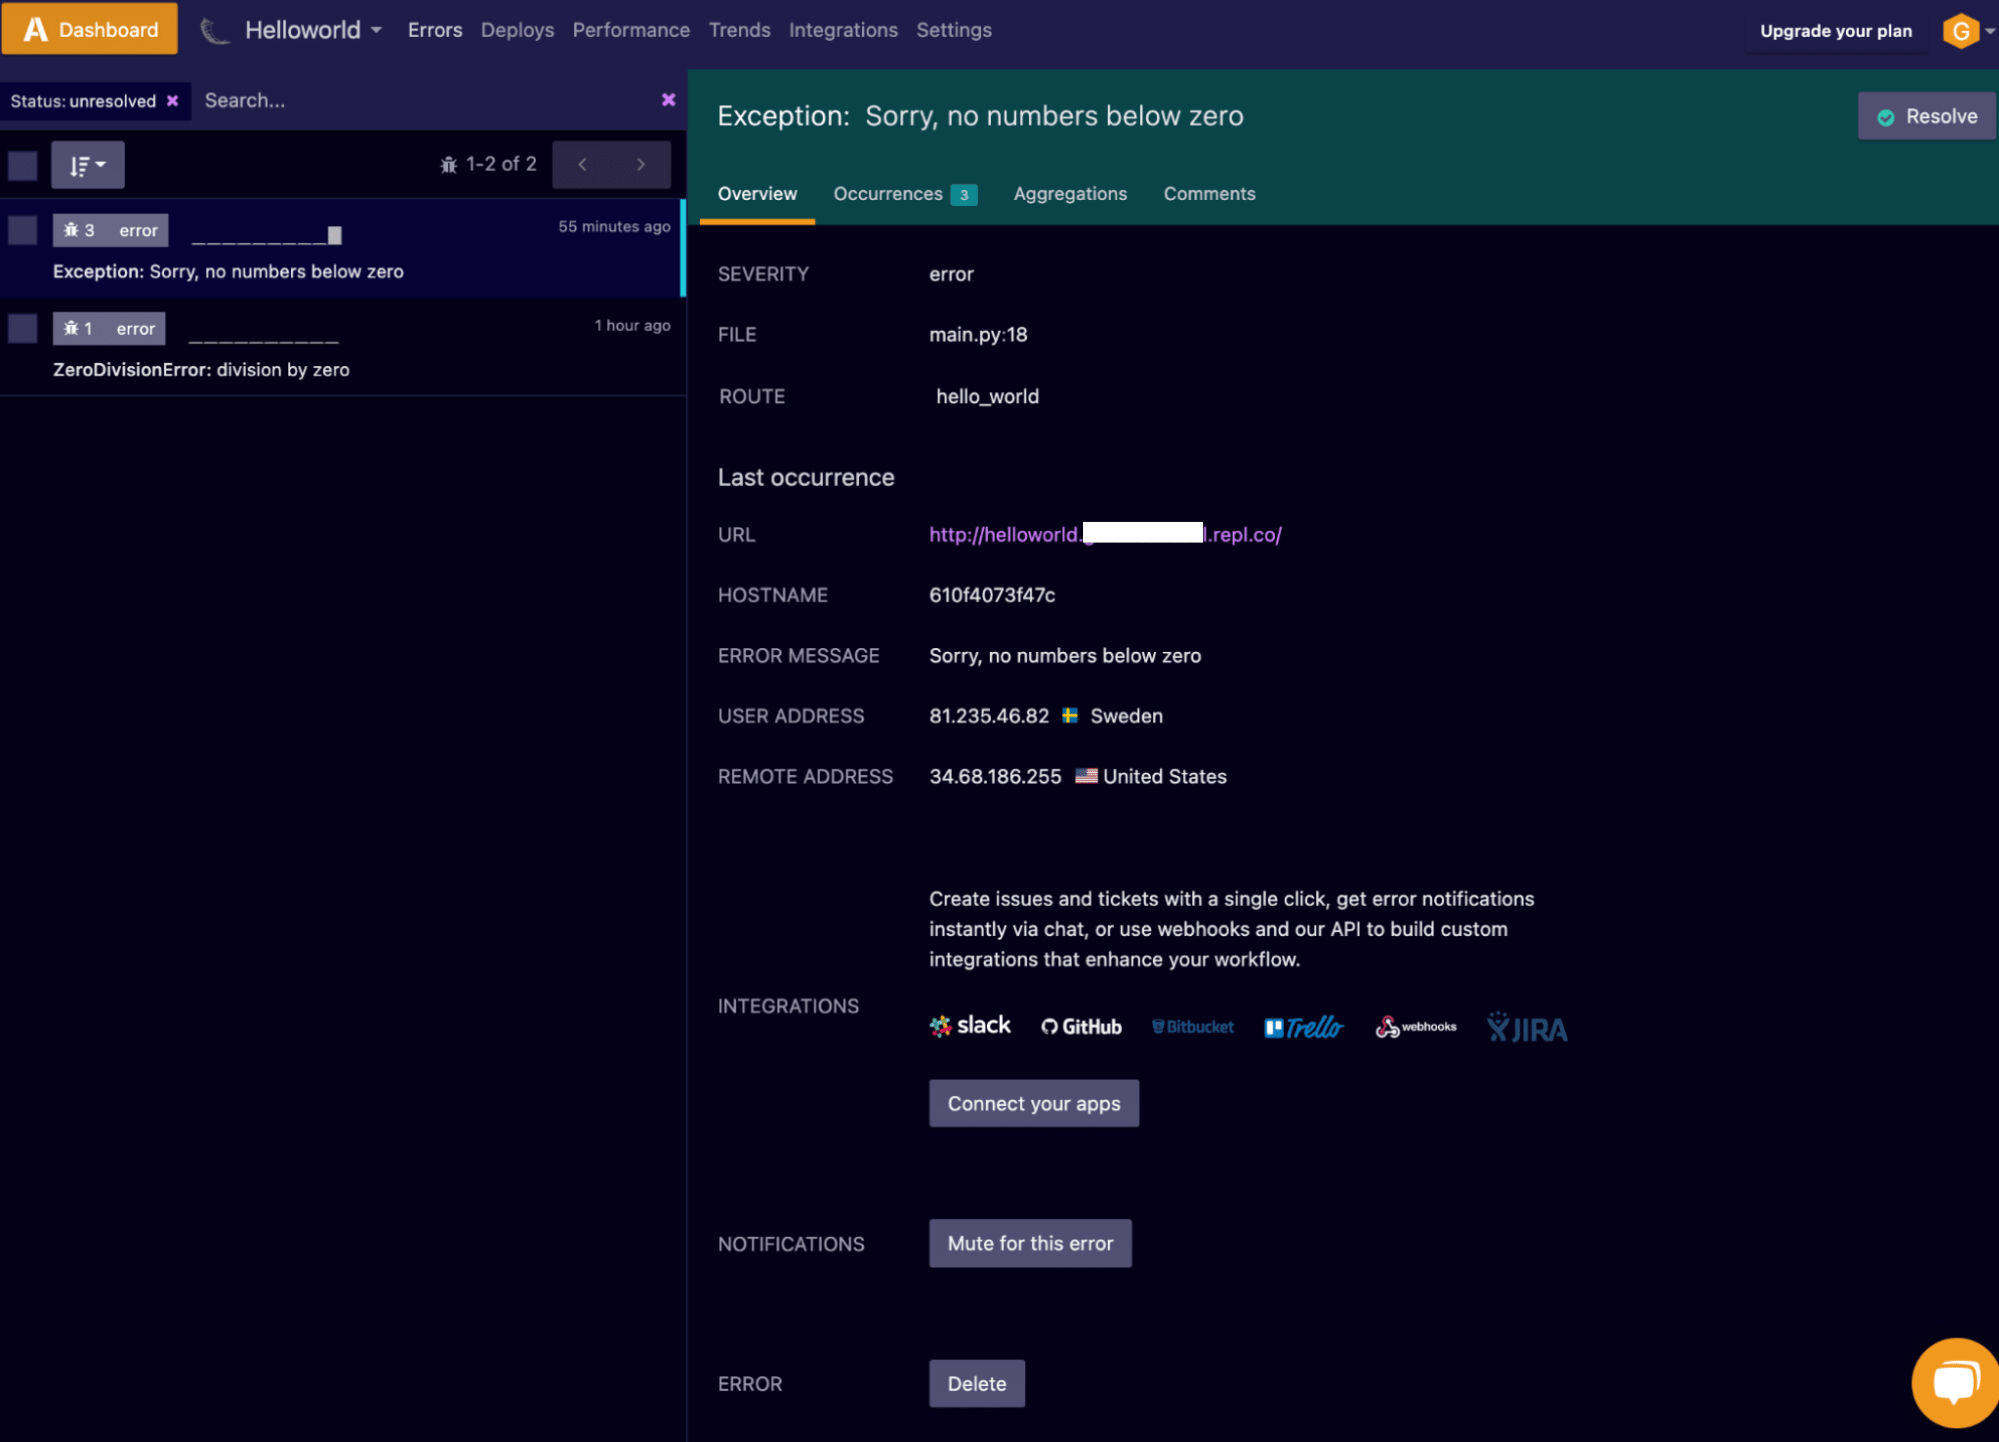
In the Airbrake Error tab, we can see that we have two different errors listed. Clicking on the latter one will allow us to get additional information on the error. We can also view many times this error has been triggered and for which file and which API call. Furthermore, you should notice that the error message has changed from “ZeroDivisionError” to “Sorry, no numbers below zero.”
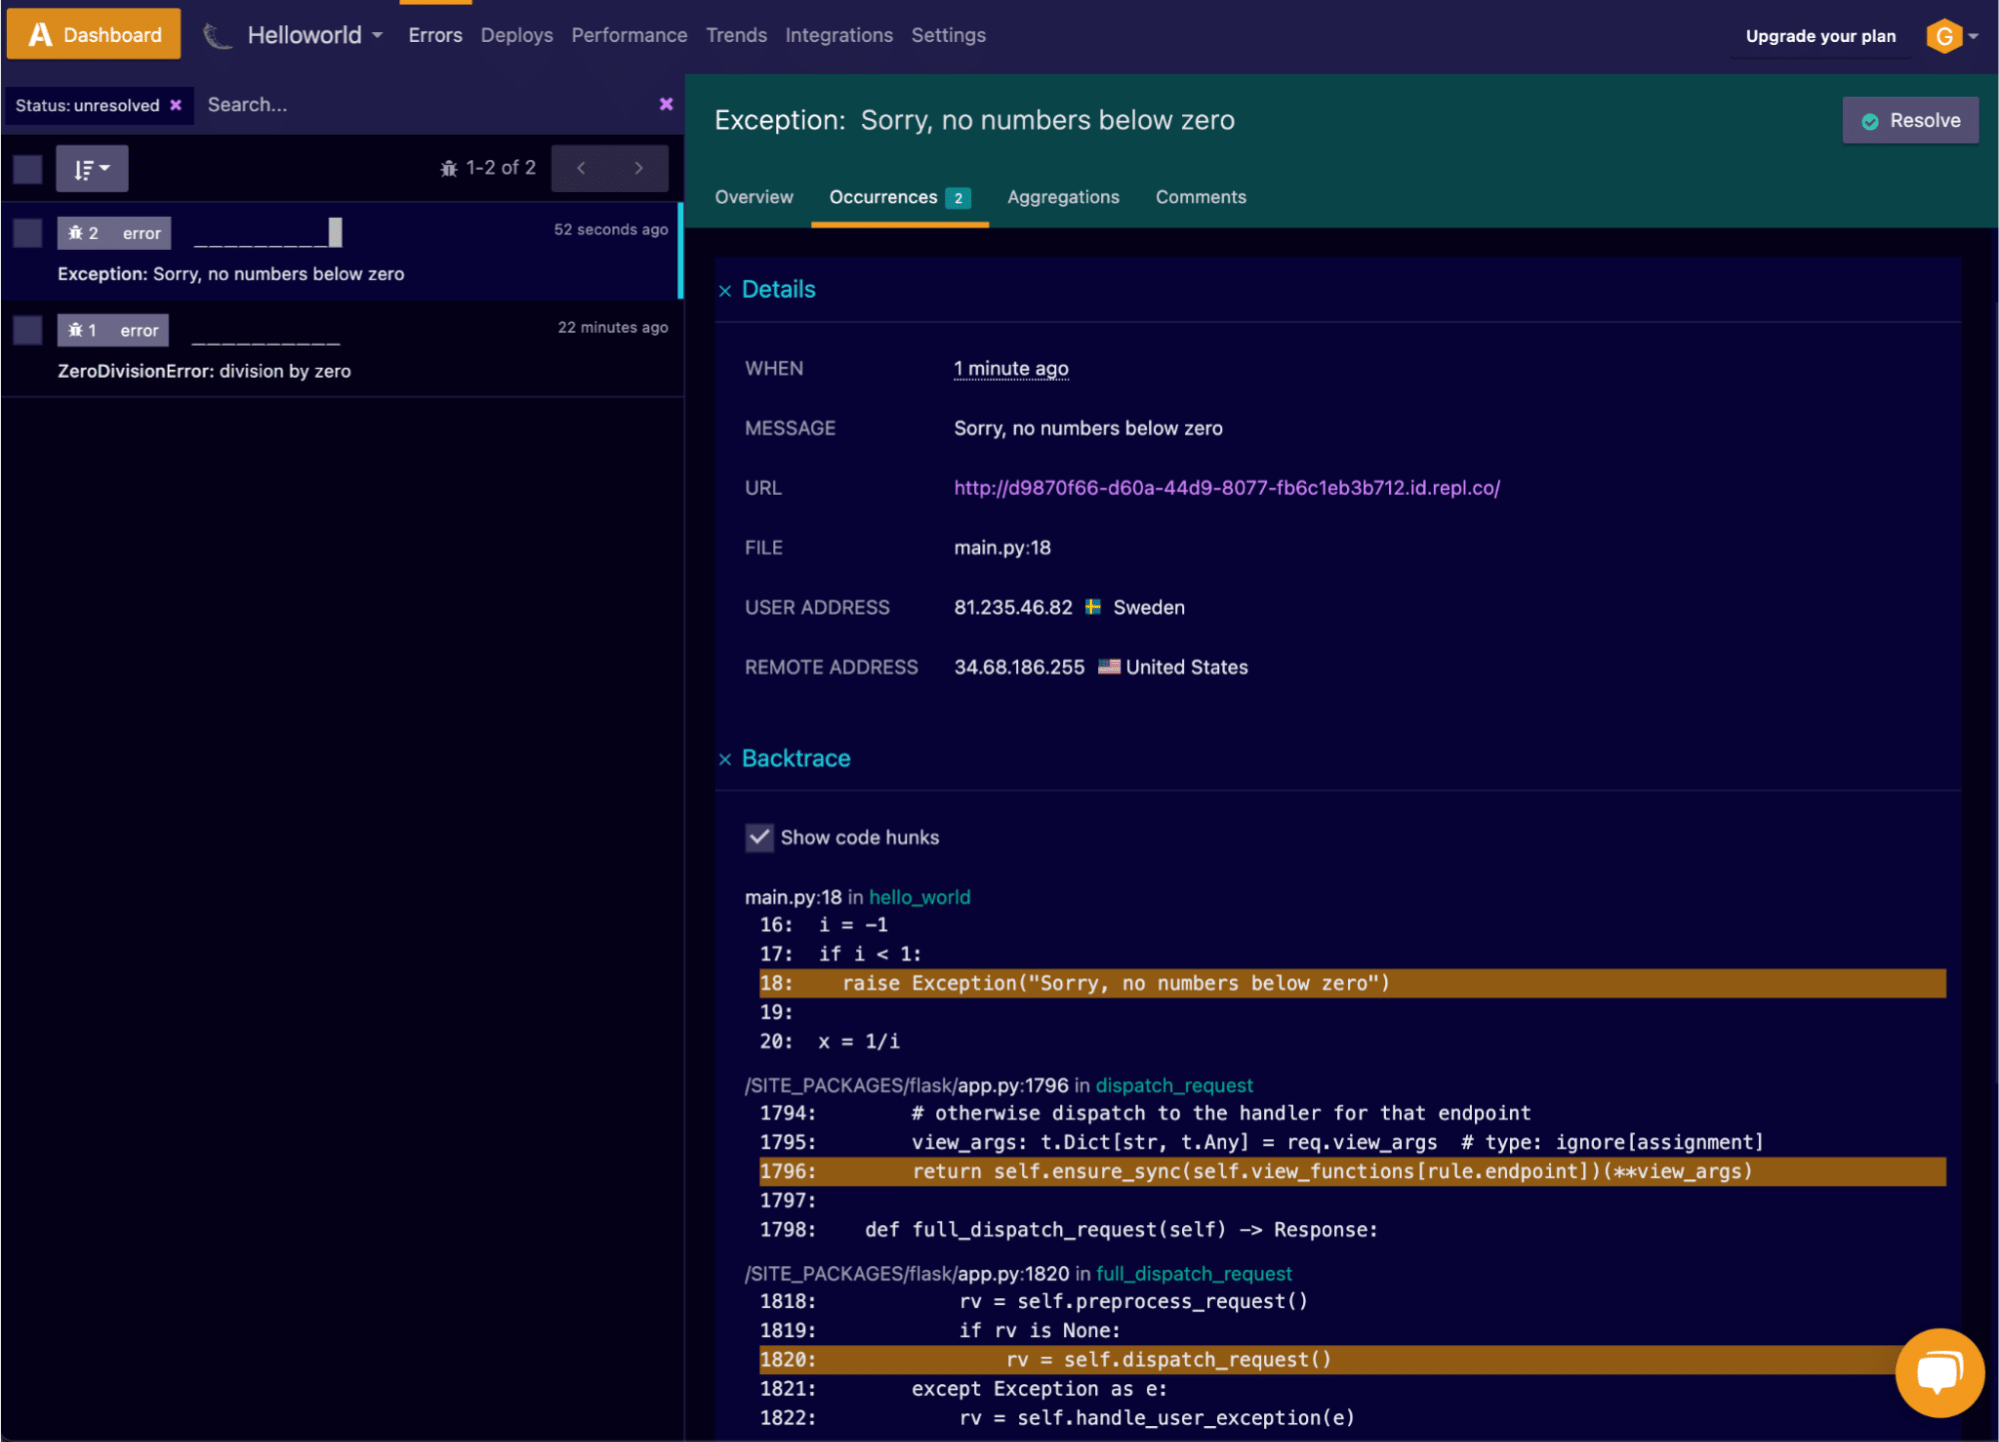
By moving to the Occurrences tab, we can get further information on the error. Including the full backtrace and a snippet of the offending code. This will allow us to see, straight from Airbrake, what the problem is.
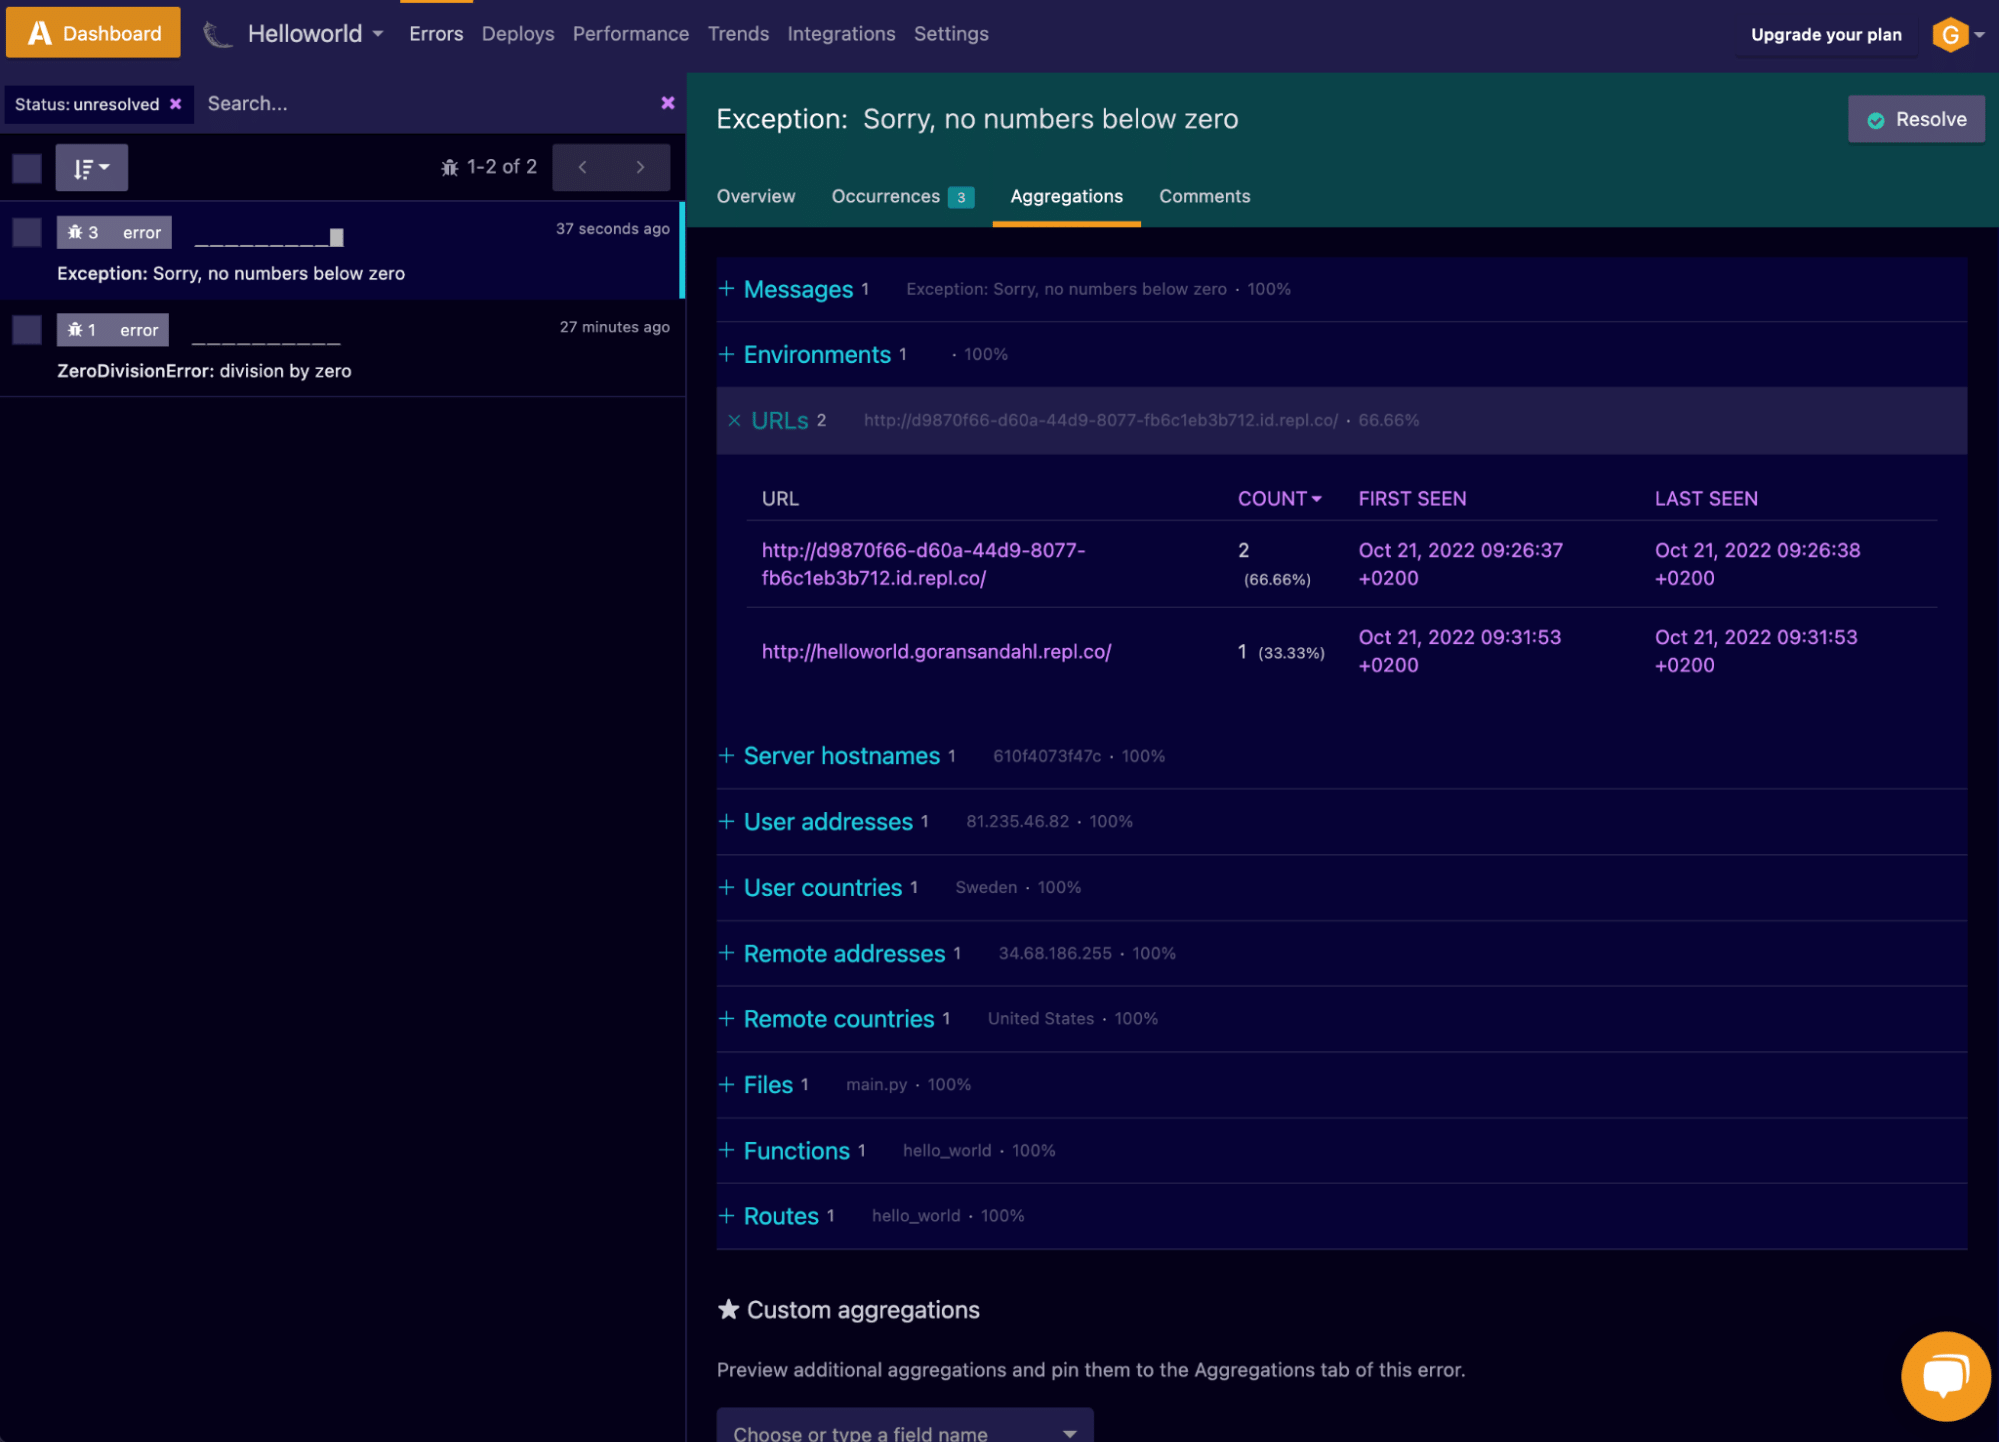
The Aggregations tab provides further details and patterns across all occurrences of this error. For example, this error has been triggered by users going to two different URLs. This represents the internal web view as well as our queries with the browser. In this tab, we can also see countries, environments, users, and any custom aggregations based on the parameters sent by the notifier. Very helpful in investigating why and where issues are happening.
Closing the loop
We can close the loop on our error by using Airbrake to keep track of and manage the status of bugs within our project. In the overview view of each error, you have the option to resolve, mute or create an issue in an external ticketing system, like JIRA or GitHub.
Here’s how it works:
Airbrake identified the problem (albeit a problem we created on purpose), and now we can fix it.
Returning to Replit, we remove the “x = 1/0” bit of code, and viola, we fixed the error (if only debugging was always this easy)! Since we have fixed the bug, choose the Resolve option for this error within your Airbrake account. This will mean that the error is removed from the list, but it will pop up if this error occurs again. A good way to get it out of the way but, at the same time, be alerted if the same error shows up in the future.
When we are in the process of fixing the error, we may want to Mute the error temporarily. This will hide it from the list, but it will not be marked as resolved. We may want to comment on the error to clarify why we muted or resolved it.
If we want to make sure this is registered as a bug in our ticketing system, we can take steps to integrate Airbrake into our ticket system, which you can find here.
Conclusion
In this article, we have explored the combination of Replit and Airbrake. Replit is a great way to quickly get code to production, and Airbrake is a great way to keep an eye on the performance and errors within that code over time. This whole process took less than 15 minutes and shows how powerful modern dev tools can be in getting things done.
We could easily have connected our code to GitHub. And as both Replit and Airbrake support that, it could vastly improve the debugging experience. For example, we could click down to the code and open up GitHub issues on problems we identify and then fix them in Replit. But that is for another time 🙂